Response Graph:
Figure 19:
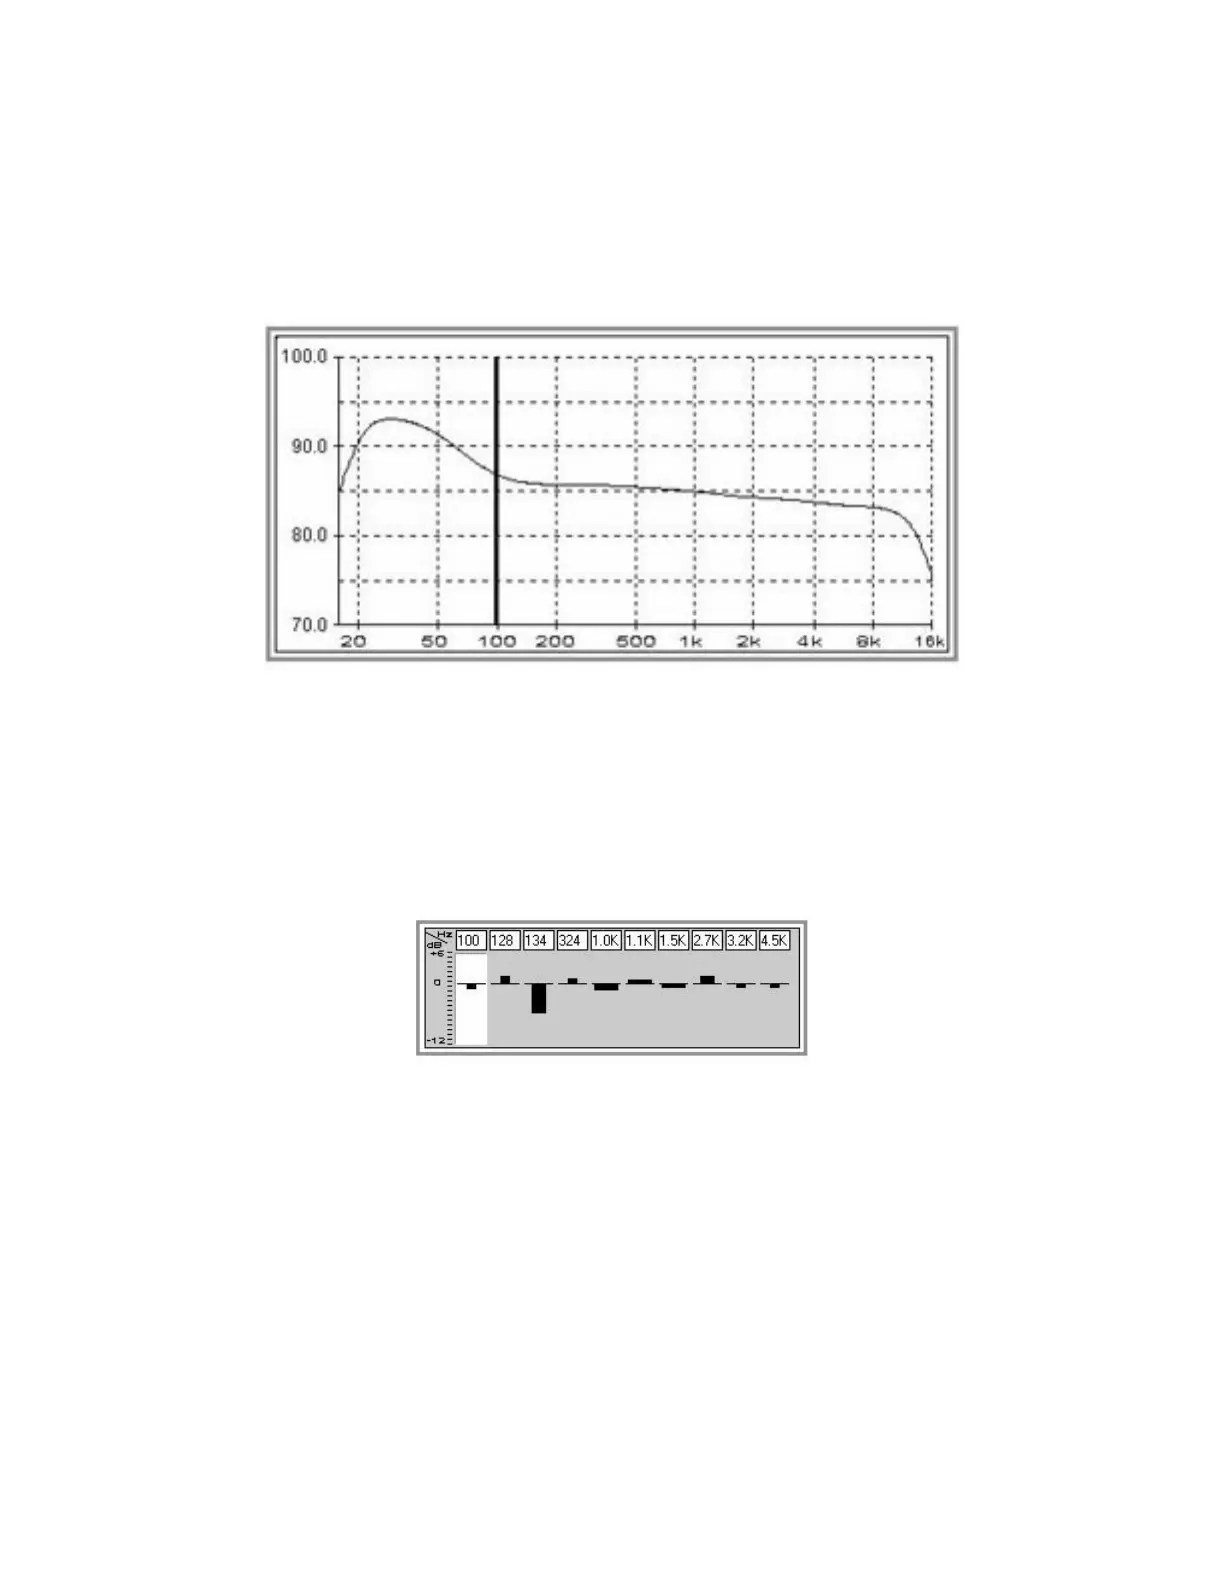
Response Graph Window
This area of the screen will display the results of each test, overlaid on the target curve. Amplitude, in dB, is indicated
vertically (Y-axis) and frequency, Hz, is indicated horizontally (X-axis). The heavy vertical line at 100Hz is the cursor
location. It indicates the center frequency of the active filter. Numerous curves can be displayed simultaneously.
Filters at a Glance:
Figure 20:
Filter Setting and Control Field
The settings of all filters can be reviewed here. Each filter’s center frequency is indicated in the small box above each bar
graph. Each bar graph gives an indication of relative boost or cut. The width of each bar indicates the relative “Q”, or
bandwidth, of each filter. Finally, the highlighted filter is the currently “active” filter. Active, in this context, means the filter
whose parameters can be adjusted. Only one filter can be active at a time.
Individual Filter Control:
4.6
DACS4 MAIN SCREEN
42
 Loading...