TP-7070 8/2032 Section 2 Operation
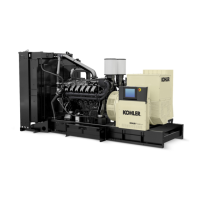
1. Choice of recording period (10 minutes, 4 hours, 8 hours,
24 hours)
2. Previous successive press
3. Zoom out
4. Zoom in
5. After successive press
6. Pause the recording or start the recording of the mechanical
value
1 2 3 4 5 6
Figure 2-22 O
il Pressure Curve (example)
Touch the recording period to select the time period:
10 minutes: record values every 1 second
4 hours: record values every 30 seconds
8 hours: record values every 1 minute
24 hours: record values every 3 minutes
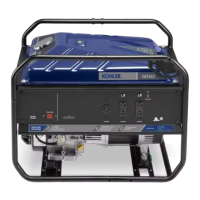
O
n any curve displayed on the screen, inserting a USB
key into the HMI port makes the USB key button appear.
See Figure 2-23. Pressing this button automatically
saves:
A curve data file (.csv) containing the information
(
data points) described in Section 2.9.4.
An image of the selected window in png format. See
Figure 2-23 for an example showing the battery
window.
1. Voltage
2. USB button
3. Current
1
3
2
Figure 2-23 Curve Window (battery data is shown for
this example)
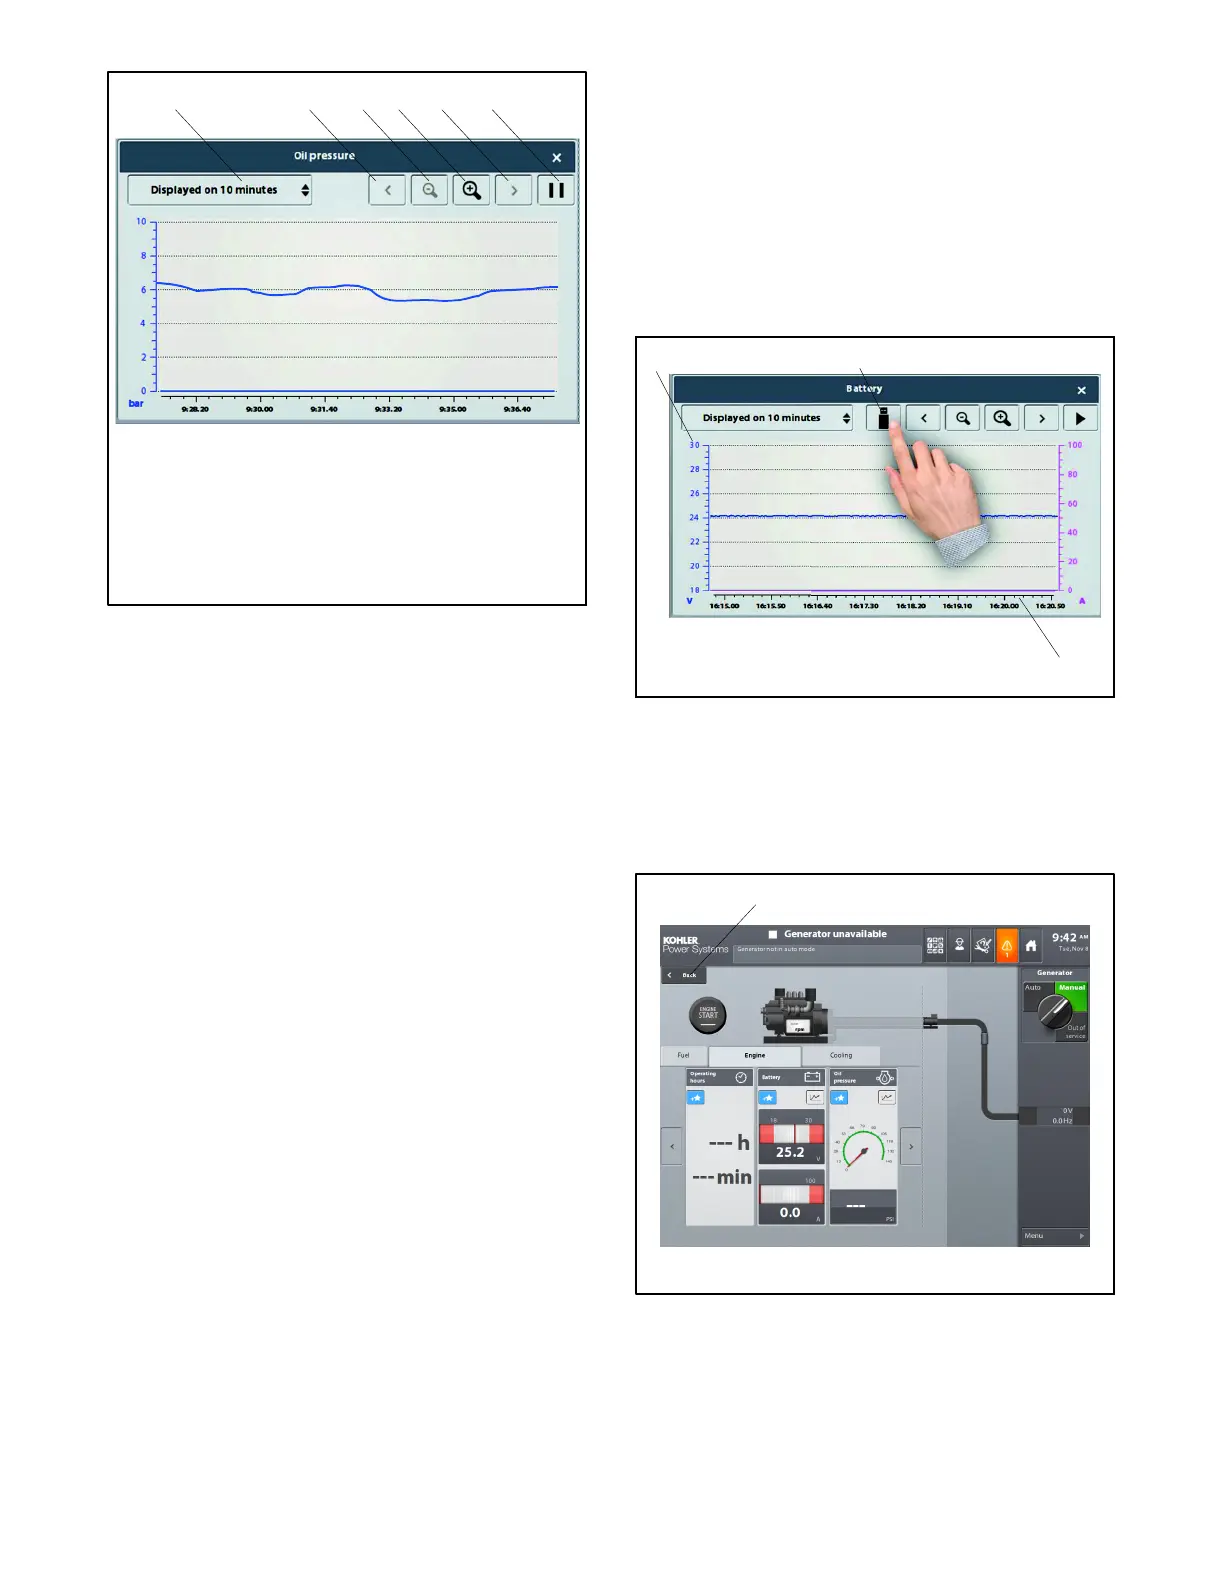
Touch the Back (< ) button to return to the overview
display. See Figure 2-24 for the location of the Back
button.
1
1. Back button
Figure 2-24 Back Button
 Loading...