Trends Operations
2 - 76 0070-10-0666-01 Trio™ Operating Instructions
2.6 Trends
2.6.1 Graphic Trend
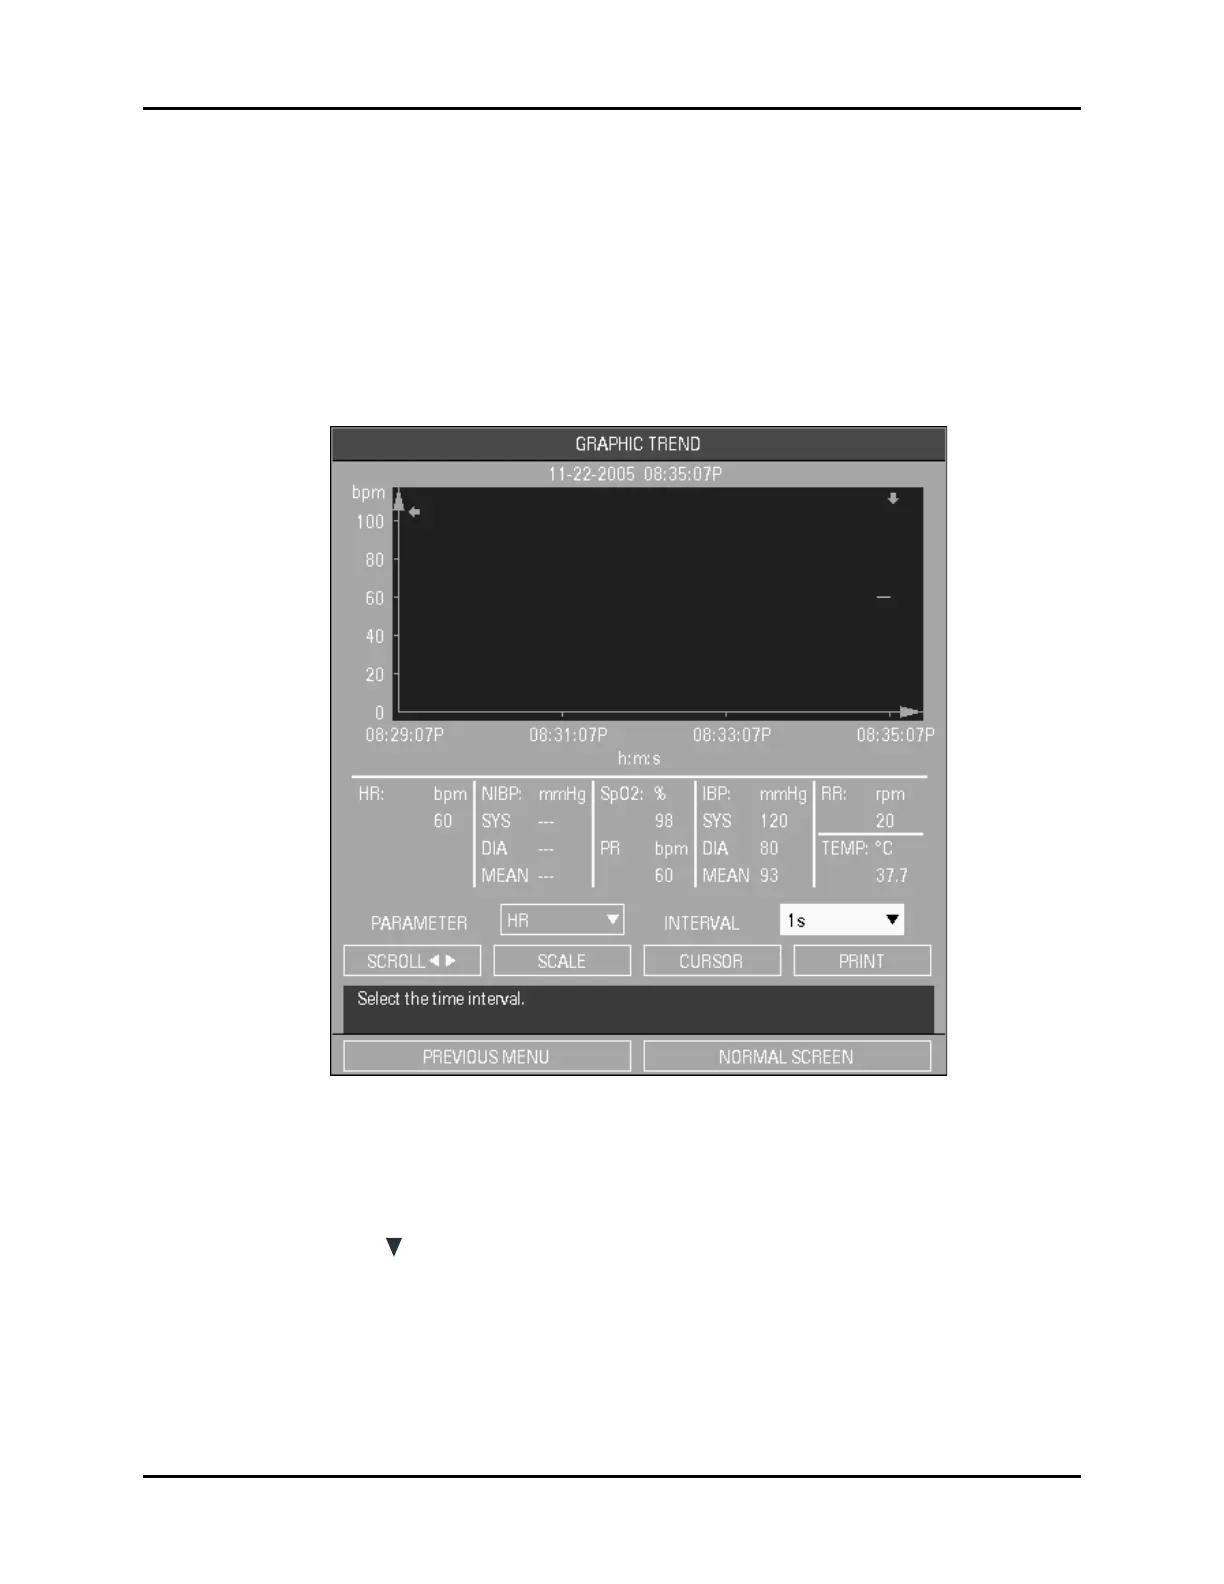
The Graphic Trend display allows the user to view a graphic summary of stored vital sign
data. The most recent 1-hour of graphic trend data can be displayed in intervals of 1 or 5
seconds. The most recent 24-hours of graphic trend data can be displayed in intervals of 1,
2, 3 or 4 minutes. Select GRAPHIC TREND from the SYSTEM MENU to access this
menu/display (see FIGURE 2-55).
FIGURE 2-55 Graphic Trend Menu/Display
In the Graphic Trend display, time stamps are plotted horizontally along the x-axis, with the
most recent data appearing on the far right. The values of the trended parameter, and the
corresponding units of measurement are plotted vertically, along the y-axis. The down arrow
symbol indicates that the value of the parameter which it points to, falls below the x-axis.
All trends, except NIBP trend, are displayed as continuous waveforms. When viewing the
NIBP graphic trend, the
W symbol indicates systolic value, the V symbol indicates diastolic
value, and * indicates mean value.
NOTE: When the monitor is powered OFF, graphic trend data is
maintained for 2 hours. If the monitor remains OFF for more
than 2 hours, the graphic trend data is deleted.
 Loading...