3
EN
TABLE 2 - Limits in relation to the length of the gate
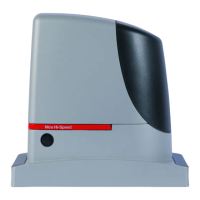
RUN1500
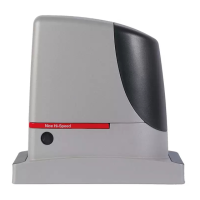
RUN1200HS
Leave
width(m)
Max. no.
of cycles/
hour
Max. no. of
consecu-
tive cycles
Max. no.
of cycles/
hour
Max. no. of
consecu-
tive cycles
Up to 4 67 33 36 21
4 ÷ 6 45 26 26 15
6 ÷ 8 37 21 23 12
8 ÷ 10 29 18 17 10
10 ÷ 12 25 15 14 8
12 ÷ 14 22 13 13 7
TABLE 3 - Limits in relation to the weight of the gate
RUN1500
RUN1200HS
Gate weight (kg) % cycles % cycles
50 ÷ 100 100% 100%
100 ÷ 200
90
80
200 ÷ 300
80
75
300 ÷ 550
75
60
550 ÷ 800
60
50
800 ÷ 1000
50
40
1000 ÷ 1200
40
30
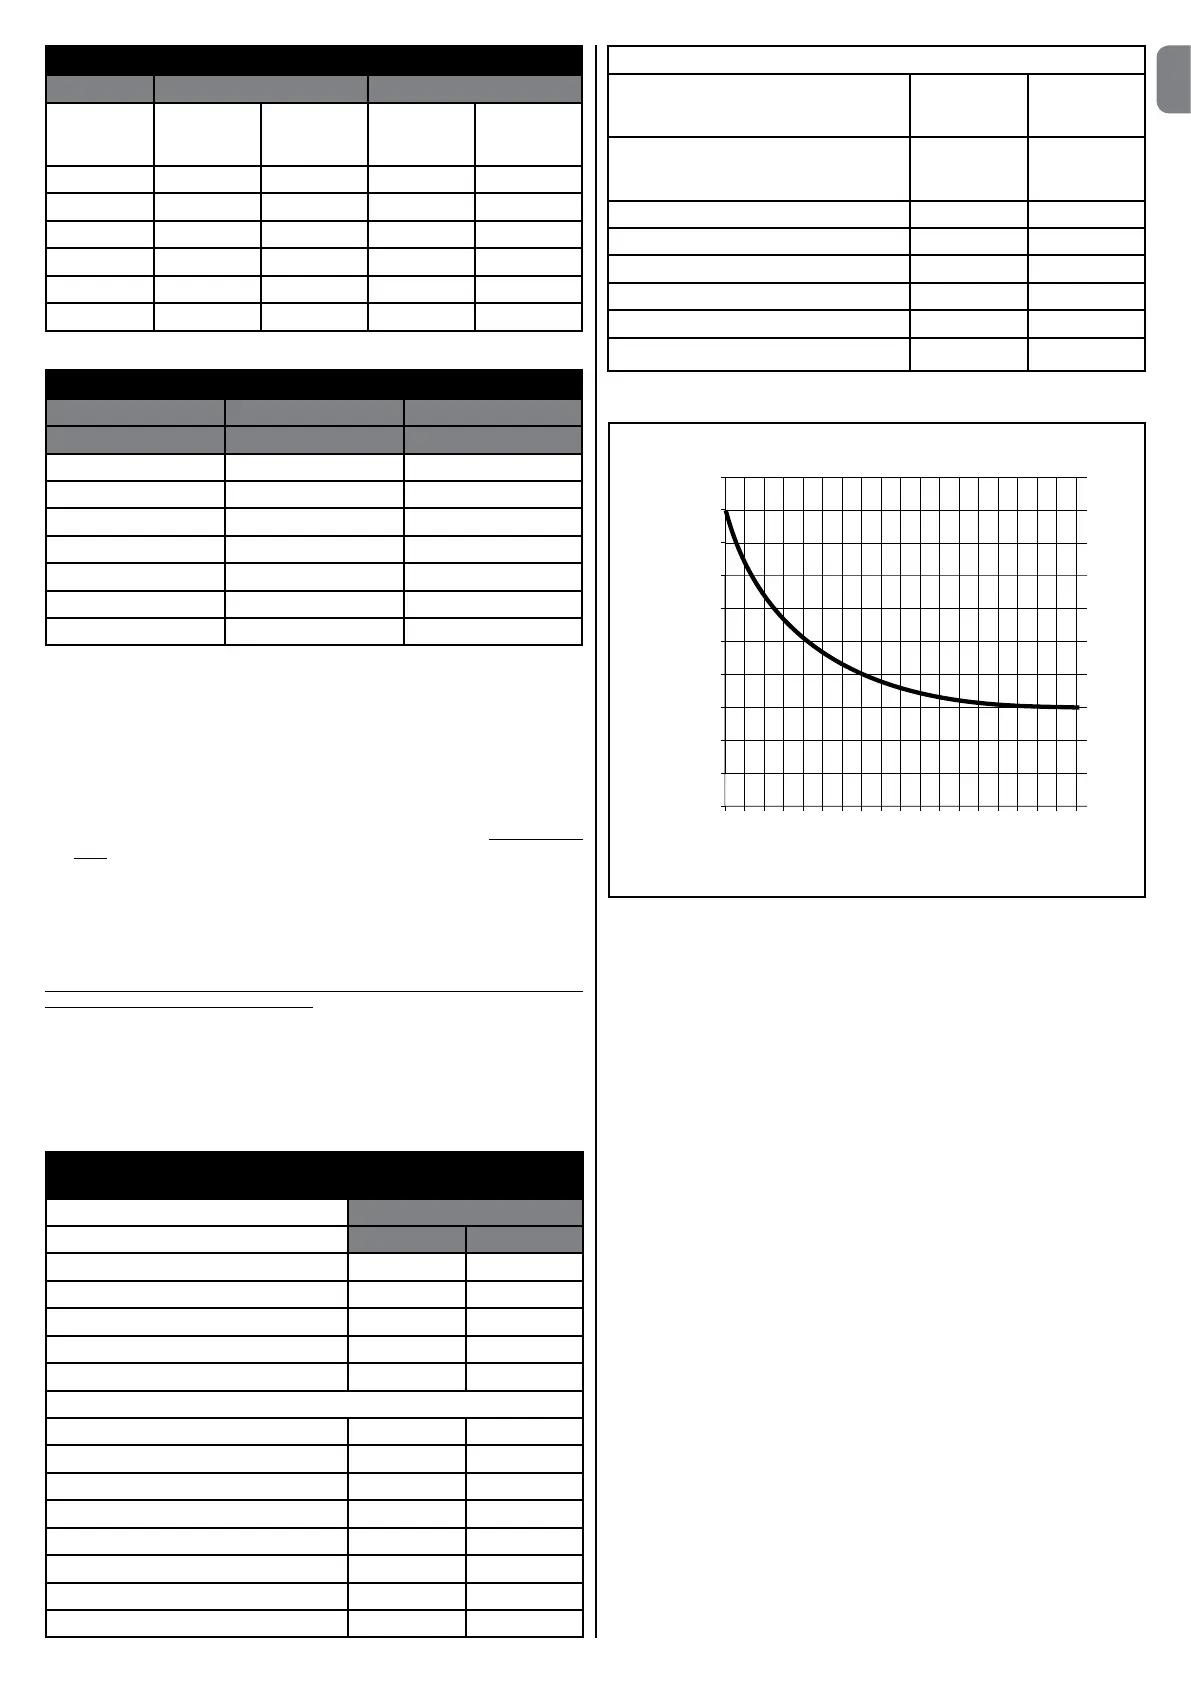
3.2.1-Productdurability
Durability is the average economic life span of the product. The value of the life
spanisstronglyinuencedbytheintensityofthemanoeuvres,i.e.thesumofall
factors that contribute to product wear, see Table 4.
To estimate the life span of your automated device, proceed as follows:
01. Add the values of the items in Table 4 regarding the system conditions;
02. In Graph 1 from the value obtained above, trace a vertical line until it inter-
sectsthecurve;fromthispointtraceahorizontallineuntilitintersectsthe
line of the “manoeuvre cycles”. The obtained value is the estimated life
span of your product.
Thelifetimevaluesspeciedinthegraphareonlyobtainableifthemaintenance
schedule is strictly observed (see chapter “Maintenance schedule”). The esti-
mation of durability is made on the basis of design calculations and the results
of tests performed on prototypes. As it is only an estimation, it does not repre-
sent any form of guarantee on the effective life span of the product.
Sample durability calculation: automation of a gate with a door 10 m long with a
weight of 150 Kg, installed near the sea:
Table 4 shows the “severity index” for this type of installation: 15% (length of gate), 30%
(weight of gate) and 10% (ambient temperature > 40°C or < 0°C or humidity > 80%”).
These indicators must be added together to obtain the overall severity index, which is
in this case 55%. With the value identied (55%), look at the horizontal axis of Graph
1 (“severity index”), and identify the value corresponding to the number of “manoeuvre
cycles” our product will be able to perform in its life span, about 180,000 cycles.
TABLE4-Estimateddurabilityinrelation
tothecycleseverityindex
Severityindex% Run
1500
1200HS
Gate length m
Up to 6 5% 5%
6 ÷ 9 10% 10%
9 ÷ 12 15% 15%
12 ÷ 14 20% 20%
Gate weight (kg)
50 ÷ 100 10% 5%
100 ÷ 200 30% 10%
200 ÷ 300 60% 20%
300 ÷ 550 30%
550 ÷ 800 40%
800 ÷ 100 50%
100 ÷ 1200 60%
Other fatigue factors (to be considered
if the probability of occurrence is greater
than 10%)
Surrounding temperature greater than
40°C or lower than 0°C or humidity
greater than 80%
10% 10%
Presence of dust and sand 15% 15%
Presence of salinity 20% 20%
Operation interrupted by photocell 10% 10%
Operation interrupted by Stop 20% 20%
Active peak force 10% 10%
Totalseverityindex%:
GRAPH 1
Severityindex%
Durability in cycles
0
50.000
10%
20%
30%
40%
50%
60%
70%
80%
90%
100%
100.000
150.000
200.000
250.000
300.000
350.000
400.000
450.000
500.000
3.3 - Works in preparation for installation
g.2 provides an example of an automation system, produced using Nice
components:
1 Key switch
2 FT210B receiver
3 Photocells
4 FT210B transmitter
5 Main mobile edge
6 Open stop bracket
7 Rack
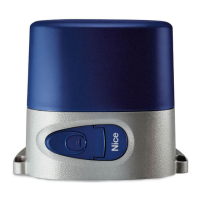
8 Flasher with integral antenna
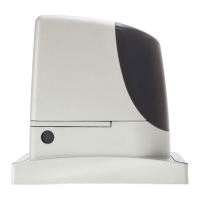
9 RUN
10 Closed stop bracket
11 Secondary mobile edge (optional)
12 Transmitter
These parts are positioned according to a typical standard layout. With refer-
encetog.2,locatetheapproximatepositionforinstallationofeachcom-
ponent envisaged in the system. Important – Before installation, prepare the
electric cables required for the system, with reference to g.2 and to “Table
5-Technicalspecicationsofelectriccables”.
Caution - When laying the ducting for routing the electrical cables, also take
into account that due to possible deposits of water in the routing ducts, the
connection pipelines might create condensate in the control unit, with conse-
quent damage to the electronic circuits.
30%
40%
50%
60%
 Loading...