Omnia-6ex Use and Operation Manual – V: 1.20
25
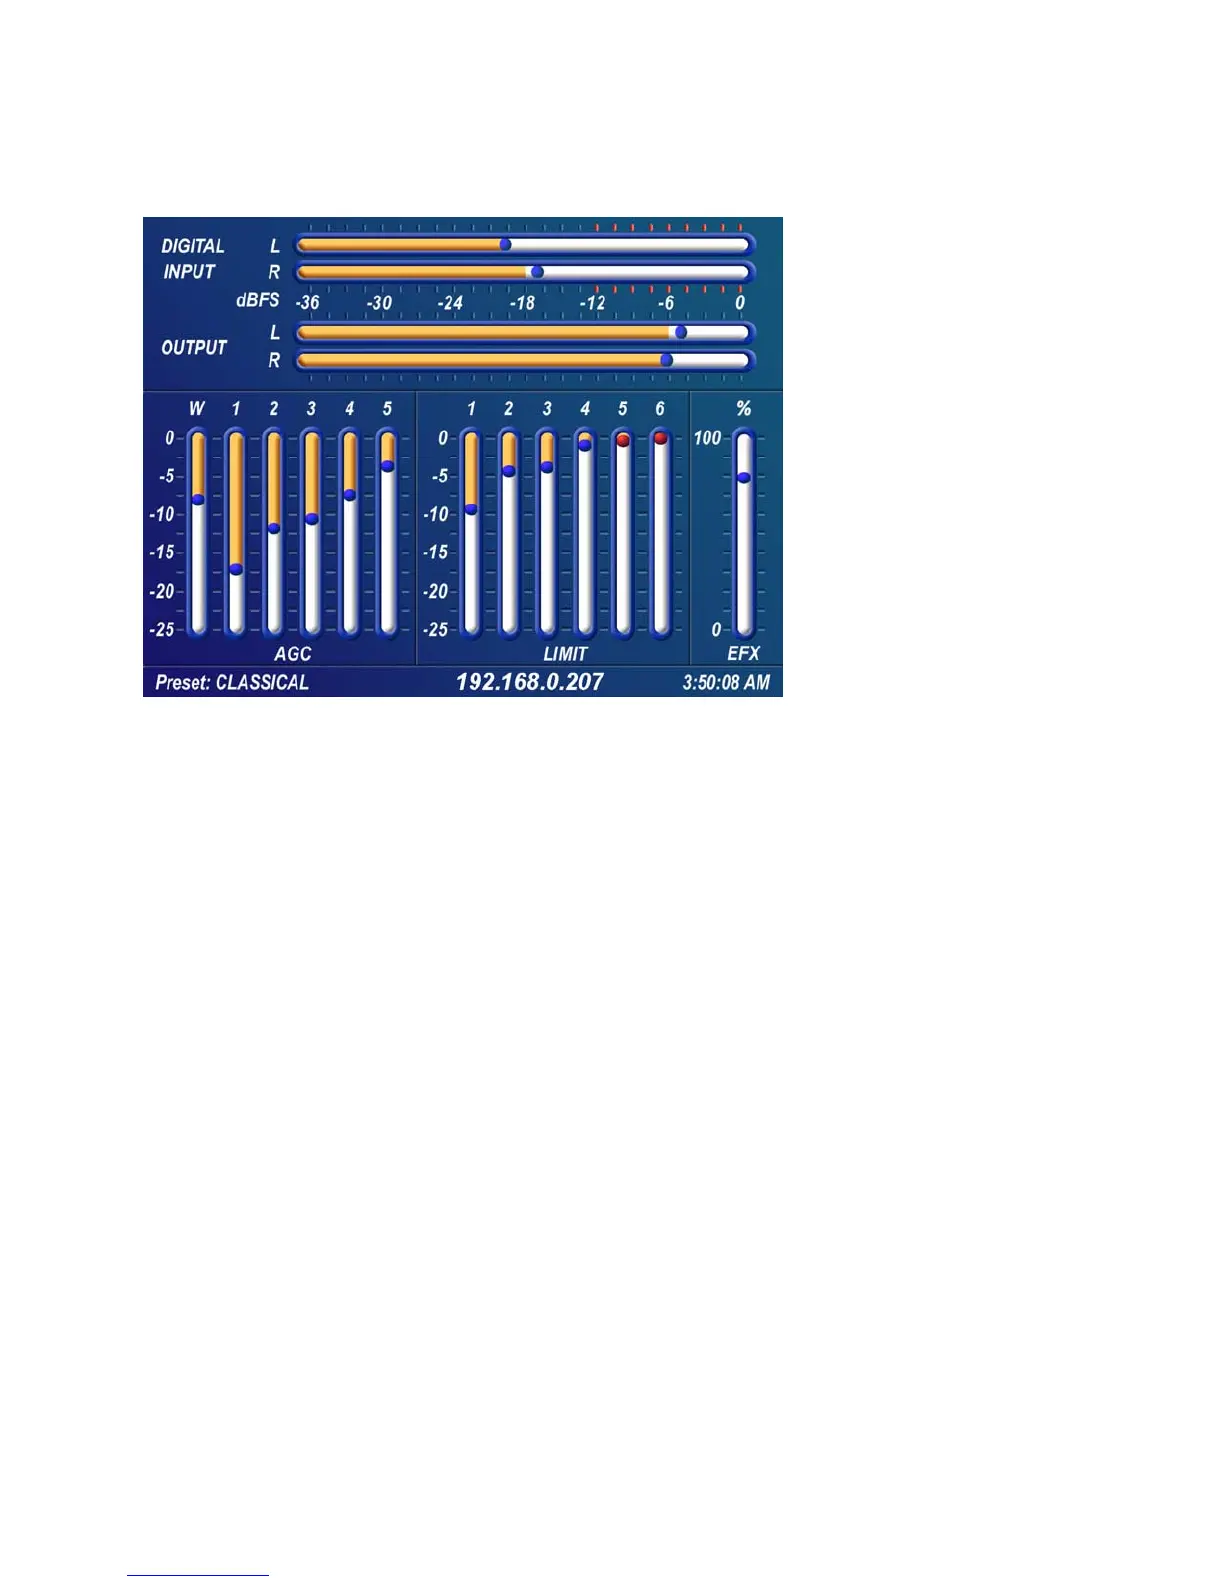
Level Meters & Processing Bargraphs
The horizontal meters show
digital, sample-accurate, peak
representations of the left and
right input and output levels,
while the vertical bargraphs show
processing activity of the various
algorithms. The currently selected
Preset Name is displayed is the
bottom left corner of the Meter
Display, the currently entered IP
address in the center and the
current time is displayed in the
lower right corner.
Left hand LCD screen showing I/O and process bargraphs
Audio I/O Level Display
The horizontal meters show the signal levels below full scale digital, (0 dBFS) which is the absolute maximum level
in the digital domain. Both input and output levels are displayed in real time. The “bouncing balls” indicate sample-
accurate peak signal levels. In normal operation, the “bouncing balls” in the Input meters should regularly indicate
between –12 and –6 dBFS. Since the meters are indicating the true peak level, this will give you about 20 dB of
"VU" system headroom given typical (not hyper-compressed) program material. The Output meters indicate the
peak levels at the analog and digital XLR outputs but not the composite MPX outputs.
Processing Display
The thirteen vertical bargraphs in the lower half of the Meter Display show the processing activity in real time
within the Omnia-6EX. The first vertical meter (labeled W) represents the processing activity in the Wideband AGC
section. The five vertical “AGC” meters show the processing activity of each of the AGCs in the multi-band AGC
section. The six vertical “Limit” meters show the processing activity in each of the limiter sections of the multi-band
limiter. Each of the meters is capable of indicating up to 25 dB of gain reduction.
The rightmost vertical bar graph (labeled EFX) indicates the processing level of the built-in Stereo Enhancement
effect, when that function has been activated.
Note: The wideband AGC and Multi-band AGCs will recover to a resting gain setting which coincides with the RTP
(Return To Platform) levels set for each band. Refer to Chapter 5, “Fine Tuning Your Sound”, for more information
on interpreting and using the processing bargraph displays.
 Loading...