Getting Started
R&S
®
ZVA
36Getting Started 1145.1090.62 ─ 13
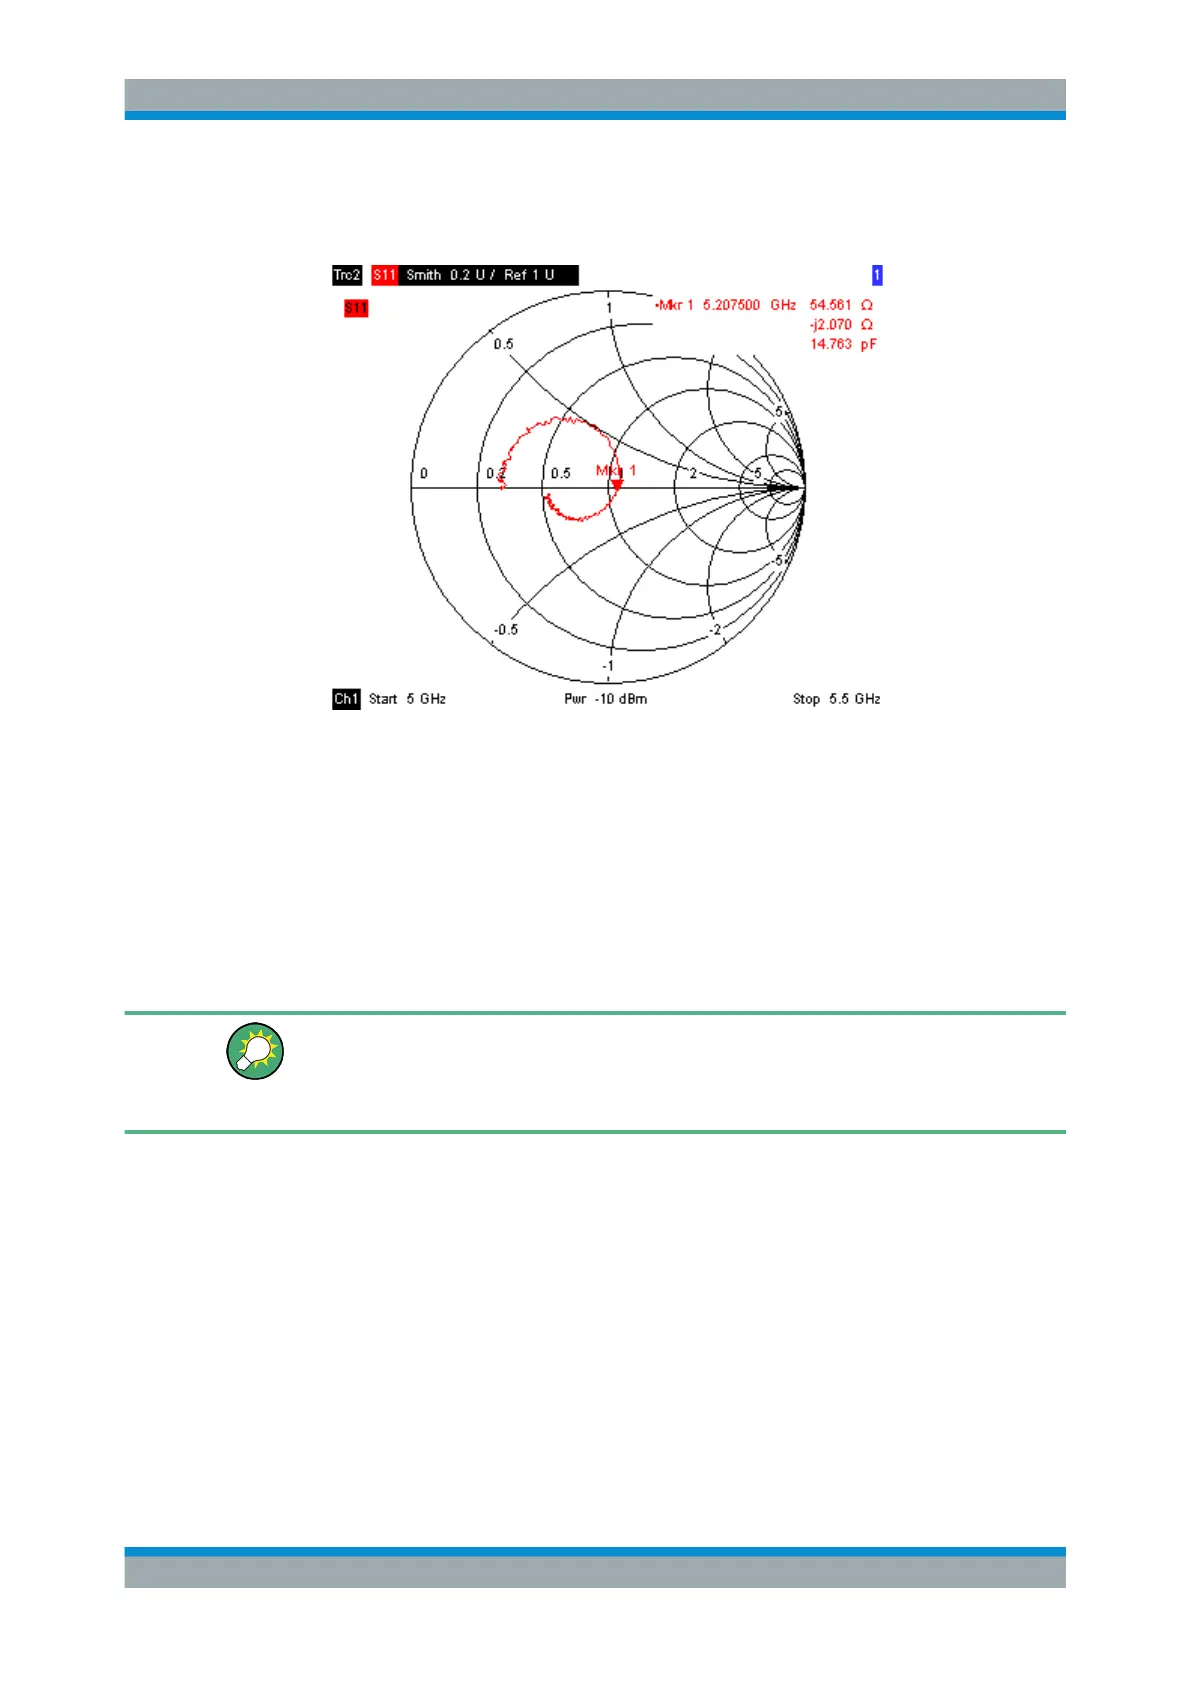
The Smith chart shows lines of constant real and imaginary part of the impedance
in the reflection coefficient plane.
Tip: Refer to section chapter 3.2.4, "Display Formats and Diagram Types",
on page 67 to learn more about the diagram properties.
2.1.5 Saving and Printing Data
The analyzer provides standard functions for saving measurement settings and for
printing the results. You can use these functions as if you were working on a standard
PC. Moreover you can export your trace data to an ASCII file and reuse it in a later
session or in an external application.
Data transfer is made easier if external accessories are connected to the analyzer or if
the instrument is integrated into a LAN. Refer to Connecting External Accessories and
chapter 1.7, "Connecting to a LAN", on page 25 to obtain information about the neces-
sary steps.
1. Press TRACE FUNCT and activate "Import/Export – Data Export".
2. In the "Export Data" dialog opened, select a file location, format and name and acti-
vate "Save".
The active trace data is written to an ASCII file.
3. Press PRINT in the SYSTEM keypad and select "Print Now" to create a hardcopy
of your diagram.
4. Select "Print to File..." or "Print to Clipboard" to copy the diagram to a file or an
external application.
5. Press SAVE in the SYSTEM keypad.
Performing a Reflection Measurement

 Loading...