Front Panel Overview | 9
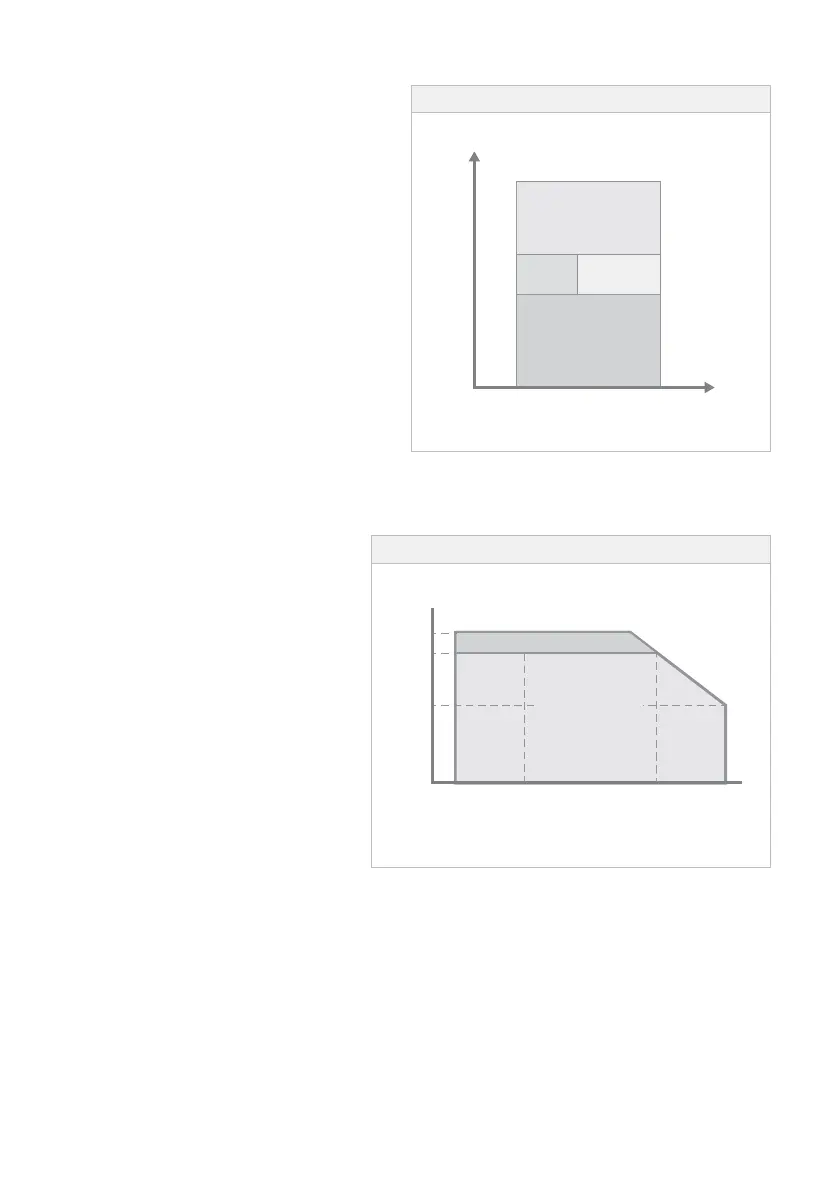
OUTPUT POWER PERFORMANCE
Figure 2 displays the length of the time the
Inverter can sustain a given Output Power (Pout)
across the input voltage range for 12 V and 24 V
variants.
Figure 2: Input Voltage vs. Output Power
VDC
16.5
(33)
12.0
(24)
10.5
(21)
200%
115%
100%
0%
Pout
Continuous
10 min.
3 min.
< 3s
POWER VS TEMPERATURE
PERFORMANCE
Figure 3 shows the derating of the
Inverter output when ambient temperature
exceeds 40°C (104°F), as well as the
minimum operating ambient temperature
of –20°C (–4°F).
Figure 3: Power vs. Temperature
Temperature °C (°F)
–20˚C
(–4˚F)
0˚C
(32˚F)
40˚C
(104˚F)
60˚C
(140˚F)
30˚C
(86˚F)
–1.5%/ ˚C
3~10 min.
100%
70%
0%
Pout
Temperature °C (°F)
–20˚C
(–4˚F)
0˚C
(32˚F)
40˚C
(104˚F)
60˚C
(140˚F)
10.5
(21)
200%
115%
100%
0%
Pout
Continuous
3 min. 10 min.
< 3 s
115%
10.5~16.5 V
21.0~33.0 V
Continuous
 Loading...