Analyze Wavefor
mData
3. Set the levels from the side-bezel menu.
Auto
Select
Use the Histog
ram method for pulses.
Histogram
(best for
pulses)
Use the Min-M
ax method for all other
waveforms.
Min-Max
(all other
wave-
forms)
For descriptions of the high and low
measurements, refer to the table of Amplitude
Measuremen
ts under Selecting Au tomatic
Measurements. (See page 91.)
Taking Manual Measurements with Cursors
Cursors are on-screen markers that you position in the waveform display to take manual measurements on acquired data.
They appear as horizontal and/or as vertical lines. To use cursors on analog or digital channels:
1. Push Cursors.
This changes the cursor state. The three
states are:
No cursors appear on the screen.
Two vertical waveform cursors
appear. They are attached to the
selected analog waveform or digital
waveforms.
Four screen cursors appear. Two are
vertical and two are horizontal. They
are no longer specifically attached to
a waveform.
2. Push Cursors again.
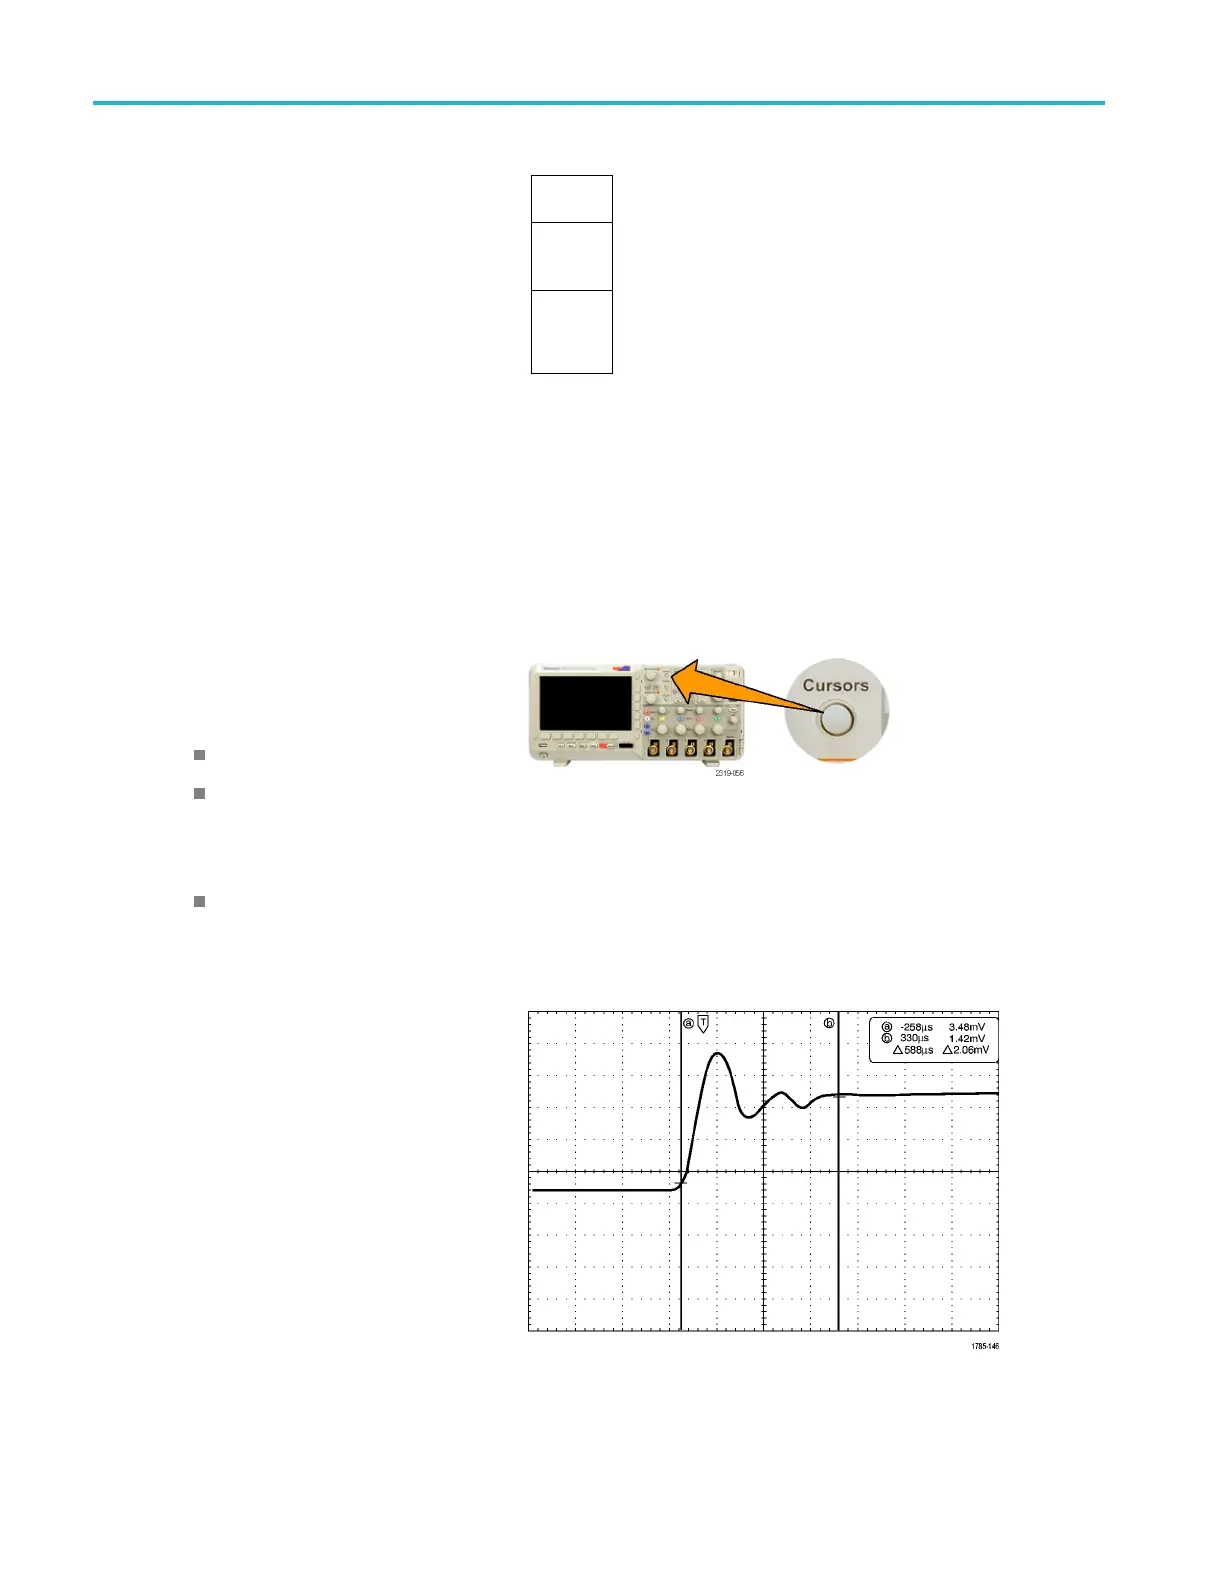
In the example, two vertical cursors
appear on the selected screen waveform.
As you turn multipurpose knob a,you
move one cursor to the right or left. As
you turn knob b, you move the other
cursor.
If you change the s elected waveform b y
pushing the front-panel 1, 2, 3, 4, M, R,
or D15-D0 button, both cursors jump to
the new selected waveform.
96 MSO2000B and DPO2000B Series Oscilloscopes User Manual
 Loading...