22 Using the Scratchpad
3. Type an expression and any other parameters required for the graph type.
4. Press · to graph the relation, or press ¤ to add another relation. If necessary,
you can use press b 4 to choose a tool on the Window/Zoom menu and adjust
the viewing area.
When you graph the relation, the entry line disappears to show an uncluttered view
of the graph. If you select or trace a plot, the relation that defines the plot is
displayed on the entry line. You can modify a plot by defining a relation or by
selecting and changing the graph.
As you graph multiple plots, the defining relation is displayed for each. You can
define and graph a maximum of 99 relations of each type.
5. Use the b key to explore and analyse the relation to:
• Trace the relation.
• Find points of interest.
• Assign a variable in the expression to a slider.
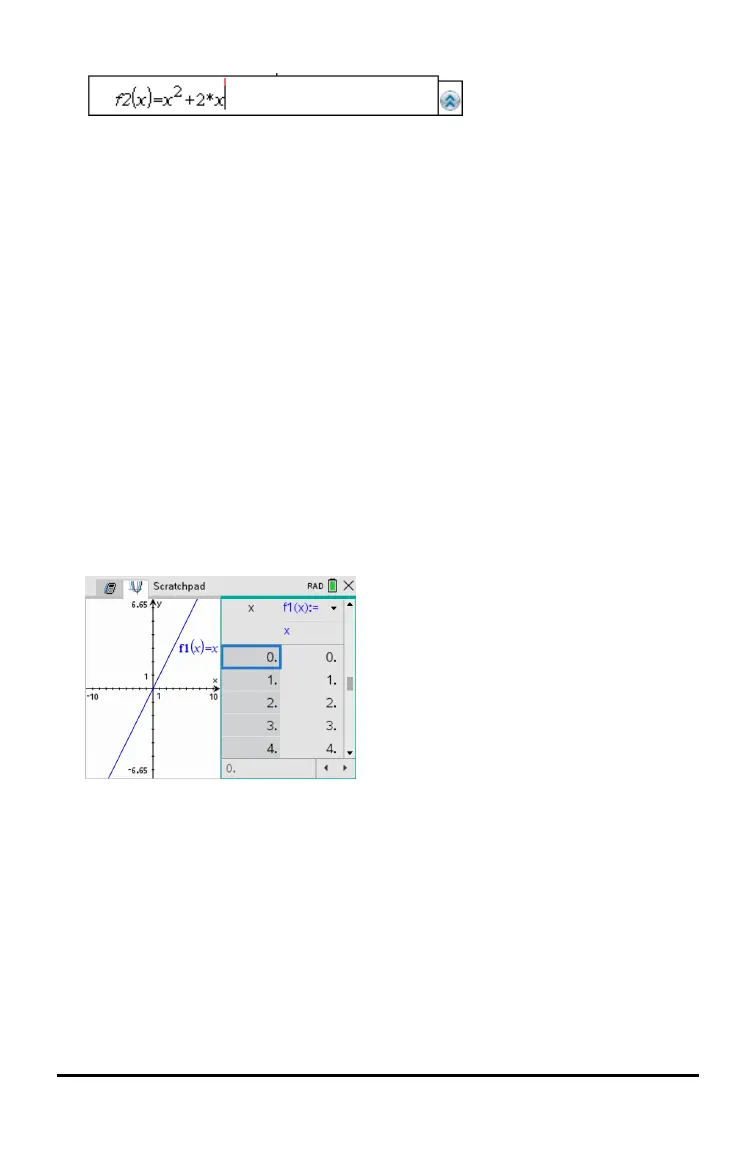
Viewing the Table
▶ To display a table of values corresponding to the current plots, press b > Table
> Split-screen Table (b 7 1).
▶ To hide the table, click the graph side of the split screen, and then press b >
Table > Remove Table (b 7 2). You can also press Ctrl + T.
▶ To resize columns, click the table and press b > Actions > Resize (b 1 1).
▶ To delete a column, edit an expression, or edit table settings, click the table and
press b > Table (b 2).
Changing the Appearance of the Axes
As you work with graphs, the Cartesian axes are displayed by default. You can change
the appearance of the axes in the following ways:
 Loading...


