Orion Benchtop pH/ISE Meter Instruction Manual
Multipoint Calibration Curve
117
Appendix E
Multipoint Calibration Curve
Orion 410Aplus, 420Aplus, 520Aplus, 525Aplus, 710Aplus, 720Aplus, and
920Aplus utilize a “point-to-point” scheme for multipoint calibrations in
both pH and CONCENTRATION modes. In this technique, straight line
segments are “drawn” between each successive pair of calibration points.
Separate slope and E
o values are calculated using the adjacent pair of data
points. For example, in a five point calibration, four slopes and five E
o’s are
calculated to correspond to the four line segments that connect the data.
Concentration or pH values for samples are calculated according to which
segment their potential values fall into. Those above or below the range of
calibration are calculated by extrapolation from the top or bottom most
segment.
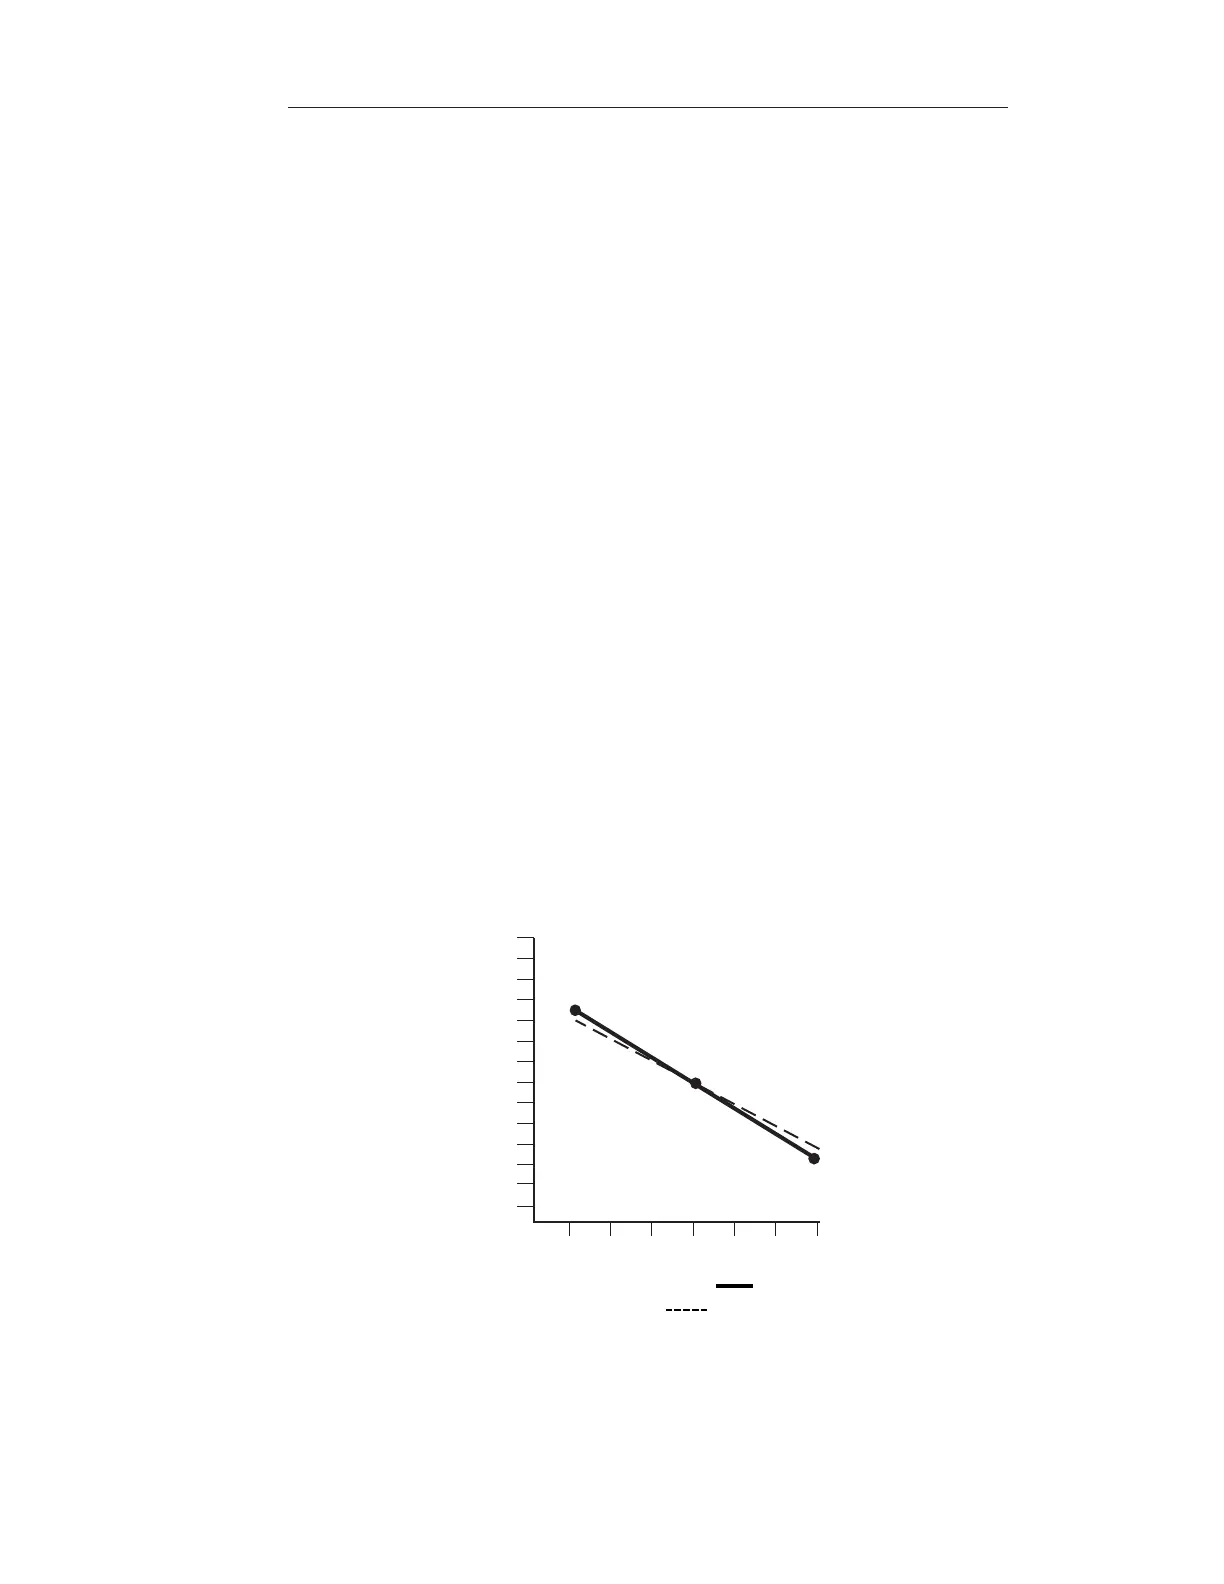
The displayed slope is an average slope of the separate segments. The slope
may be outside the range normally expected for an electrode. For example,
if the slope of one segment is low, then the average will be lower than
theoretical, even though the response may be Nernstian over most of
the range.
See Figure below for an example of a typical calibration curves using
this method.

 Loading...