UTD2000 Series User Manual
50
Chapter XII Applicaion example
Example 1: Measuring simple signals
To observe and measure an unknown circuit signal, and to quickly display and
measure the signal's frequency and peak-to-peak value.
(1) To quickly display this signal, follow the steps below:
① In the probe menu, set the attenuation factor to 10X and set the switch on the
probe to 10X.
② Connect the CH1 probe to the circuitry point to be measured.
③ Press AUTO, the oscilloscope will carry out auto setup to optimise waveform
display. In this status, you can further adjust the vertical and horizontal range until you
get the desired waveform display.
(2) Voltage and time parameters for automatic measurement
Your oscilloscope can automatically measure most display signals. To measure signal
frequency and peak-to-peak value, follow the steps below:
①. Press MEASURE to display auto measurement menu.
②. Press F4 to enter custom parameter selection window.
③. Move the slection box through multifunctional knob to peak-to- peak value
and then press multifunctional knob to complete the selection of peak-to-peak
parameter.
④. According to step ○3 , move the selection box to Frequency and press
multifunctional knob to complete the selection of frequency parameter
measurement.
⑤. Press F4 or MENU to close custom parameter selection window.
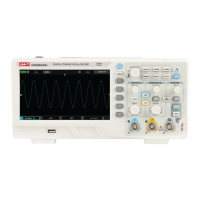
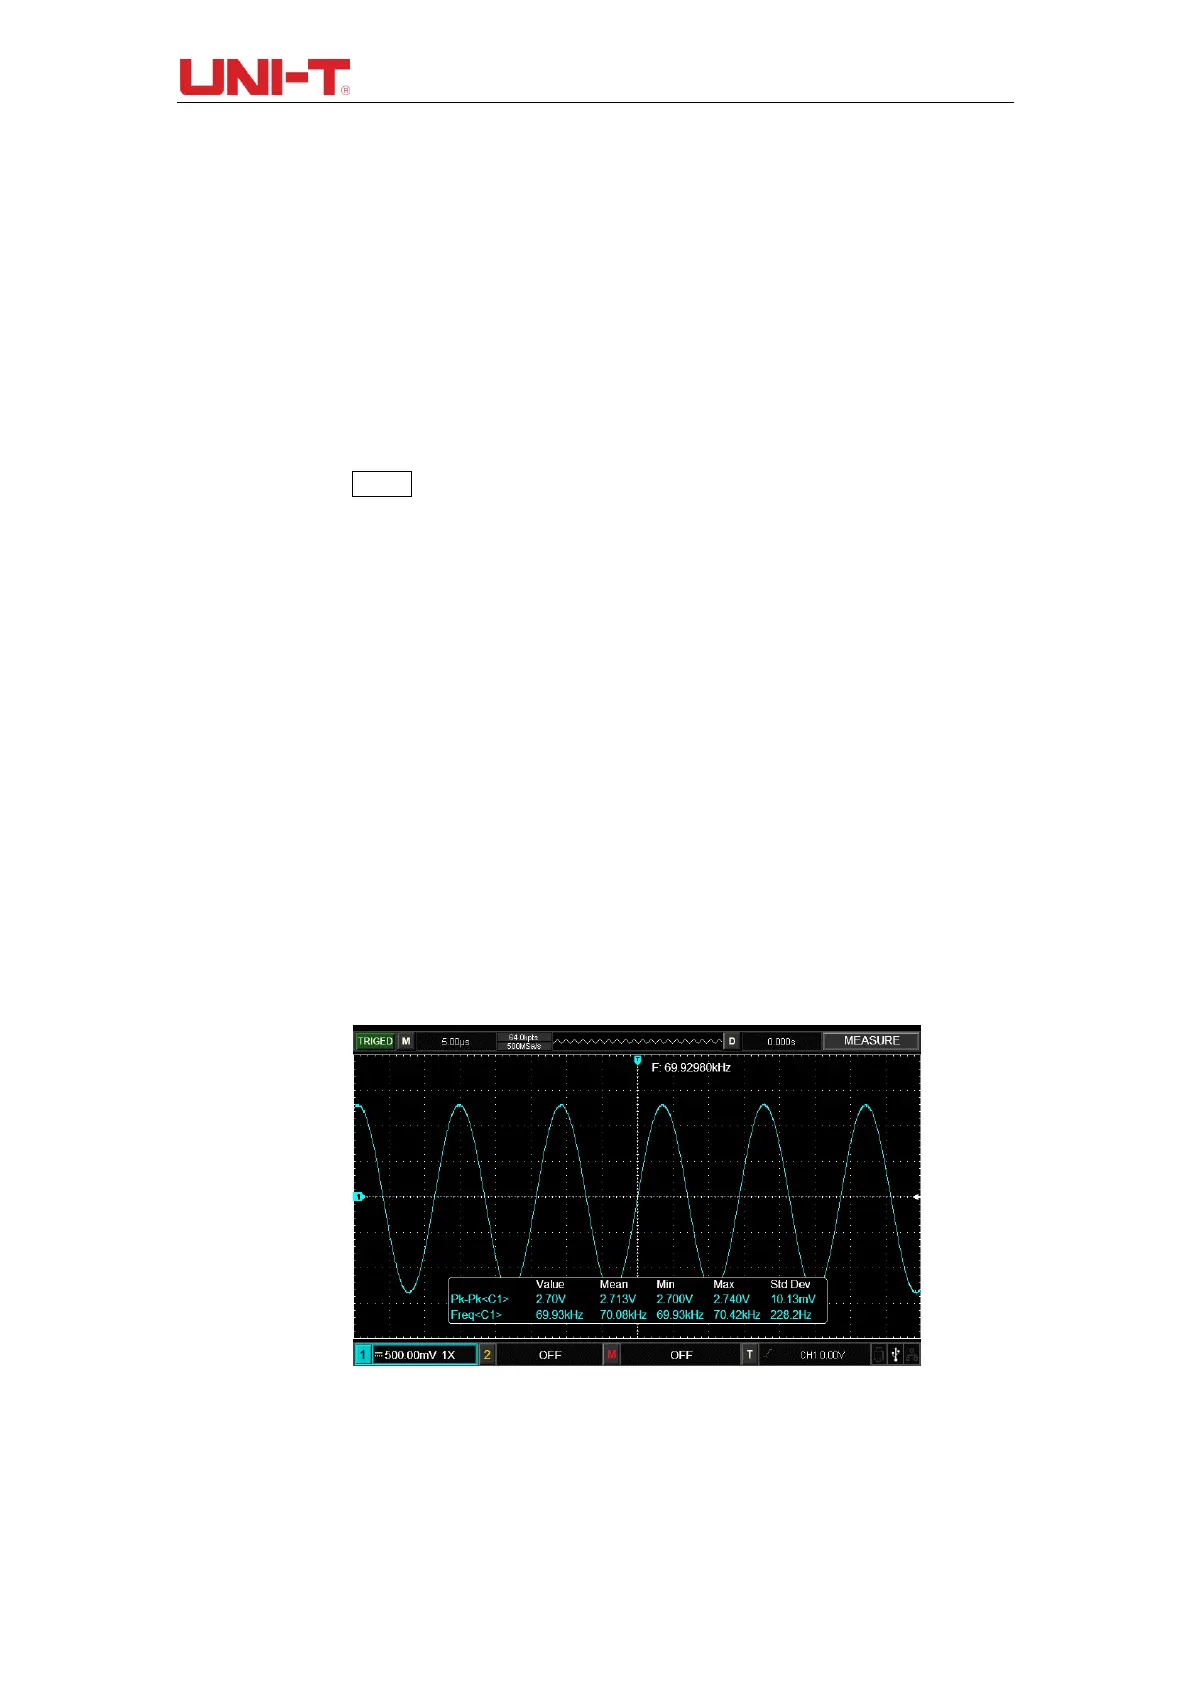
Peak-to-peak value and frequency value display on the screen as shown in
the figure below:
Figure 12-1 Automatic measurement
Example 2: Observing the delay caused by a sine wave signal passes through the
circuit
As in the previous scenario, set the probe attenuation factor of the probe and
 Loading...