6 U1241B/U1242B User’s and Service Guide
1Getting Started
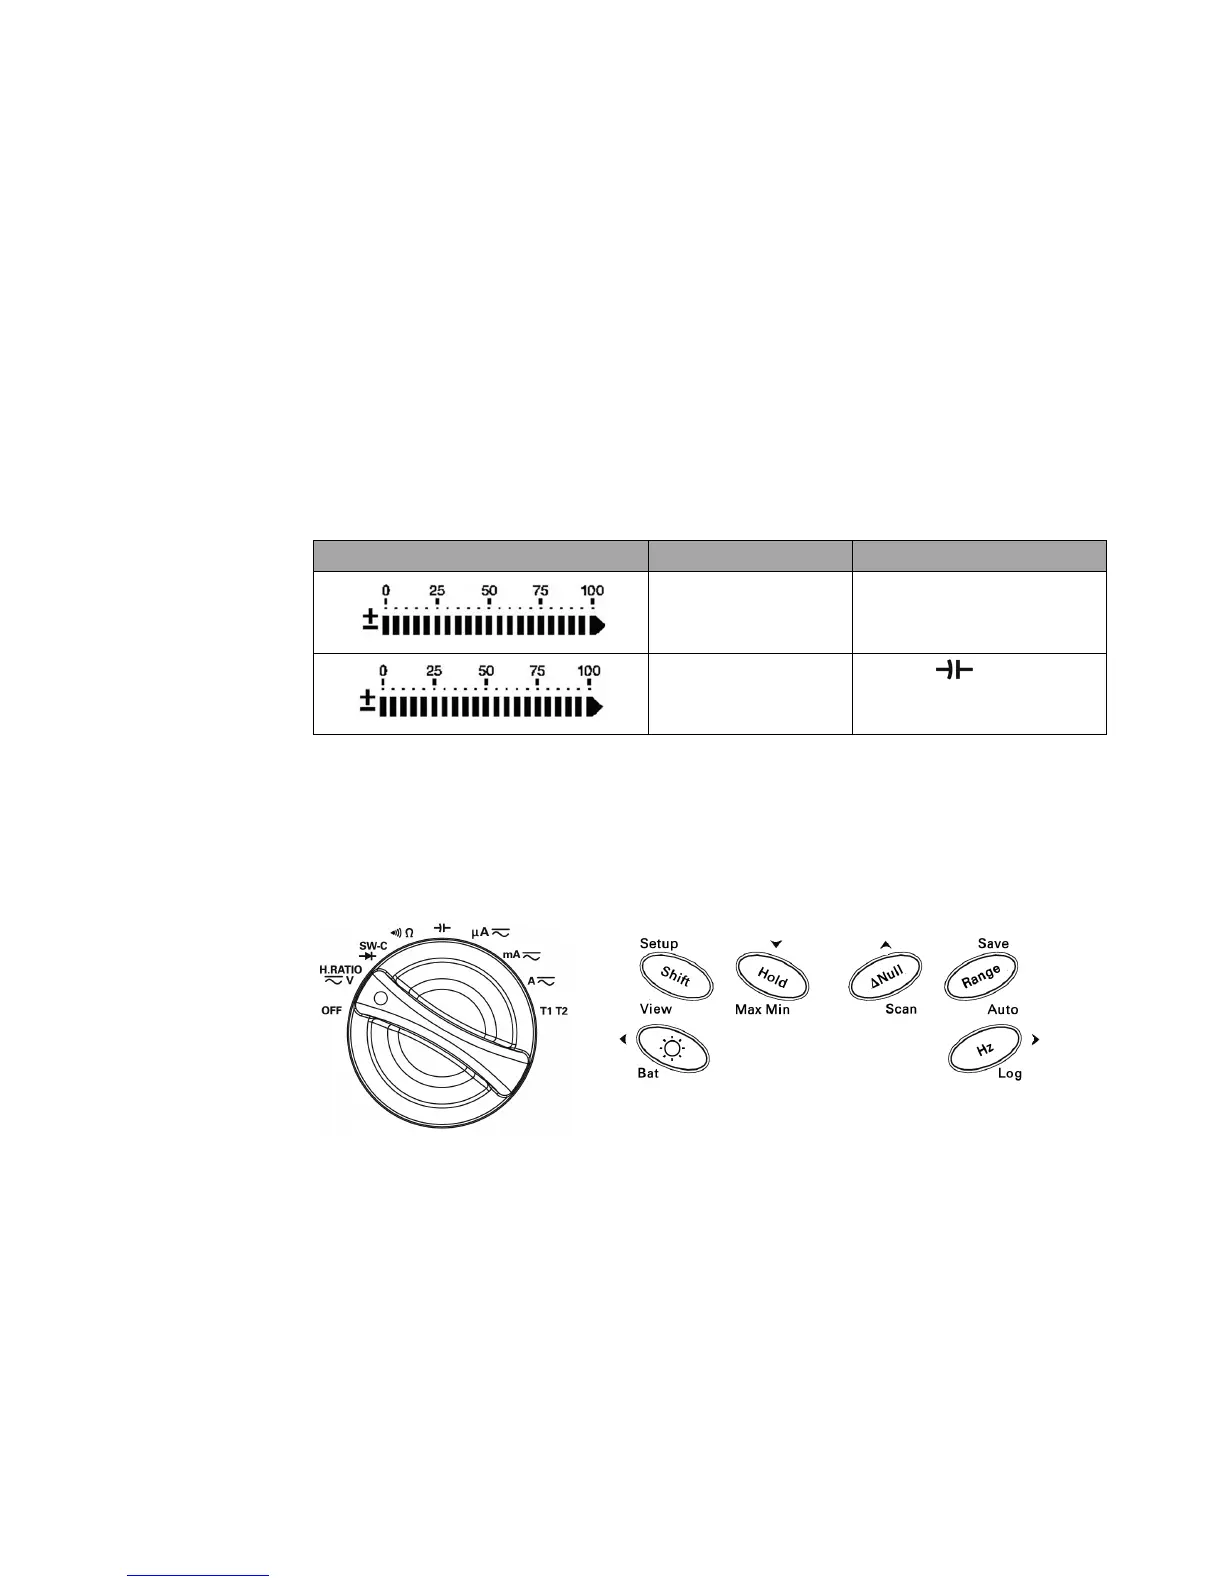
Analog Bar Graph
When frequency is indicated on the primary display during voltage or
current measurement, the bar graph represents the voltage or current
value. When 4–20 mA% scale or 0–20 mA% scale is indicated on the
primary display, the bar graph represents the current value. Each segment
represents 500 or 50 counts depending on the range indicated on the peak
bar graph.
Table 1-3 Bar graph counts
The Keypad and Rotary Switch at a Glance
Figure 1-4 Keypad and rotary switch of a U1242B handheld digital multimeter
Range Counts / Segment Function
50 Diode
500 V, A, Ω,
 Loading...