97
Statistical Graphs and Calculations Chapter 7
kk
kk
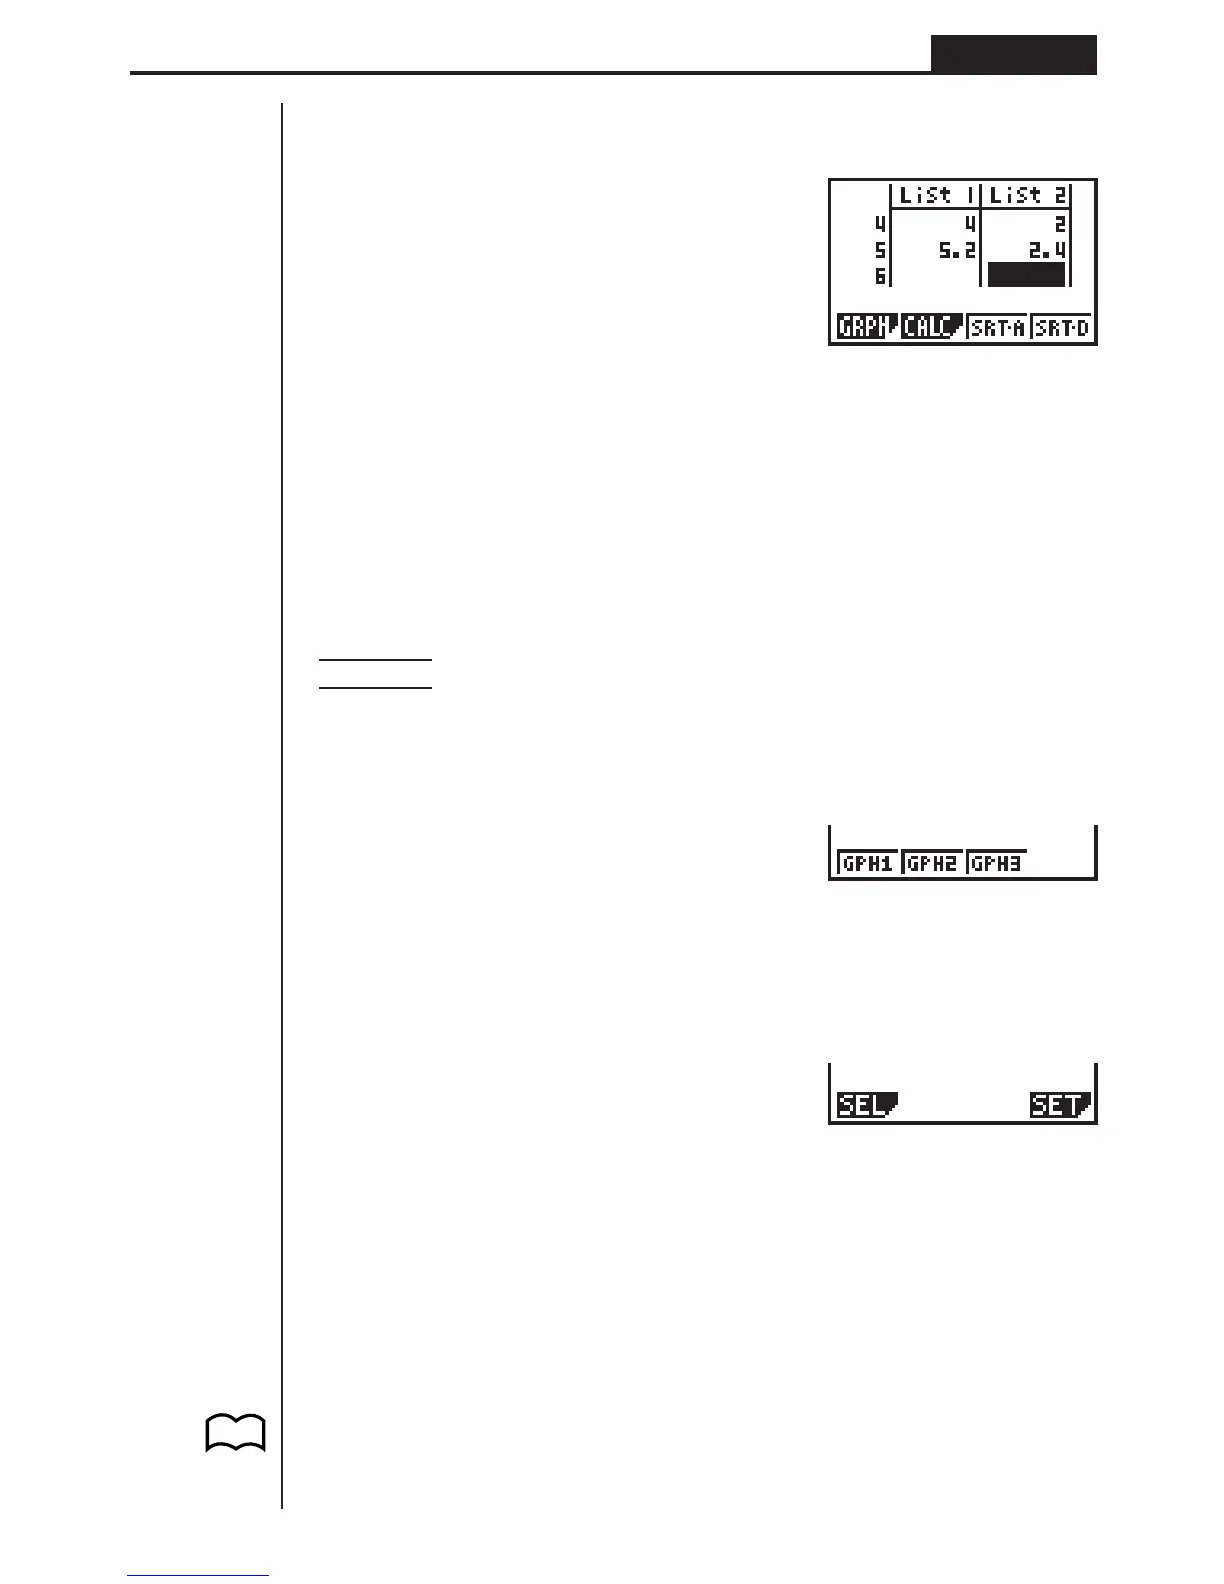
k Inputting Data into Lists
Input the two groups of data into List 1 and List 2.
a.fwb.cw
c.ewewf.cw
e
-c.bwa.dw
b.fwcwc.ew
Once data is input, you can use it for graphing and statistical calculations.
•Input values can be up to 10 digits long (9-digit mantissa and 2-digit exponent
when using exponential format). Values in statistical data table cells are shown
only up to six digits.
•You can use the f, c, d and e keys to move the highlighting to any cell in
the lists for data input.
kk
kk
k Plotting Data
Example To specify Graph 1 as non-draw (OFF) and Graph 3 as draw (ON)
and use Graph 3 to plot the data you input into statistical data
List 1 and List 2 above
While the statistical data list is on the display, press 1 (GRPH) to display the graph
menu.
1(GRPH)
1 (GPH1) ..... Graph 1 draw
2 (GPH2) ..... Graph 2 draw
3 (GPH3) ..... Graph 3 draw
[
1(SEL) ......... Graph (GPH1, GPH2, GPH3) selection
4(SET) ......... Graph settings (graph type, list assignments)
Press [ to return to the previous menu.
•You can specify the graph draw/non-draw status, the graph type, and other gen-
eral settings for each of the graphs in the graph menu (GPH1, GPH2, GPH3).
•You can press any function key (1,2,3) to draw a graph regardless of the
current location of the highlighting in the statistical data list.
• The initial default graph type setting for all the graphs (Graph 1 through Graph 3)
is scatter diagram, but you can change to one of a number of other graph types.
P.99
1234 [
1 234 [
 Loading...