121
Statistical Graphs and Calculations Chapter 7
2(Man)
Q(Returns to previous menu.)
1(GRPH)1(GPH1)
Here we will illustrate this operation by making histogram settings for Graph 1.
The following are the meanings of the items that appear in this screen.
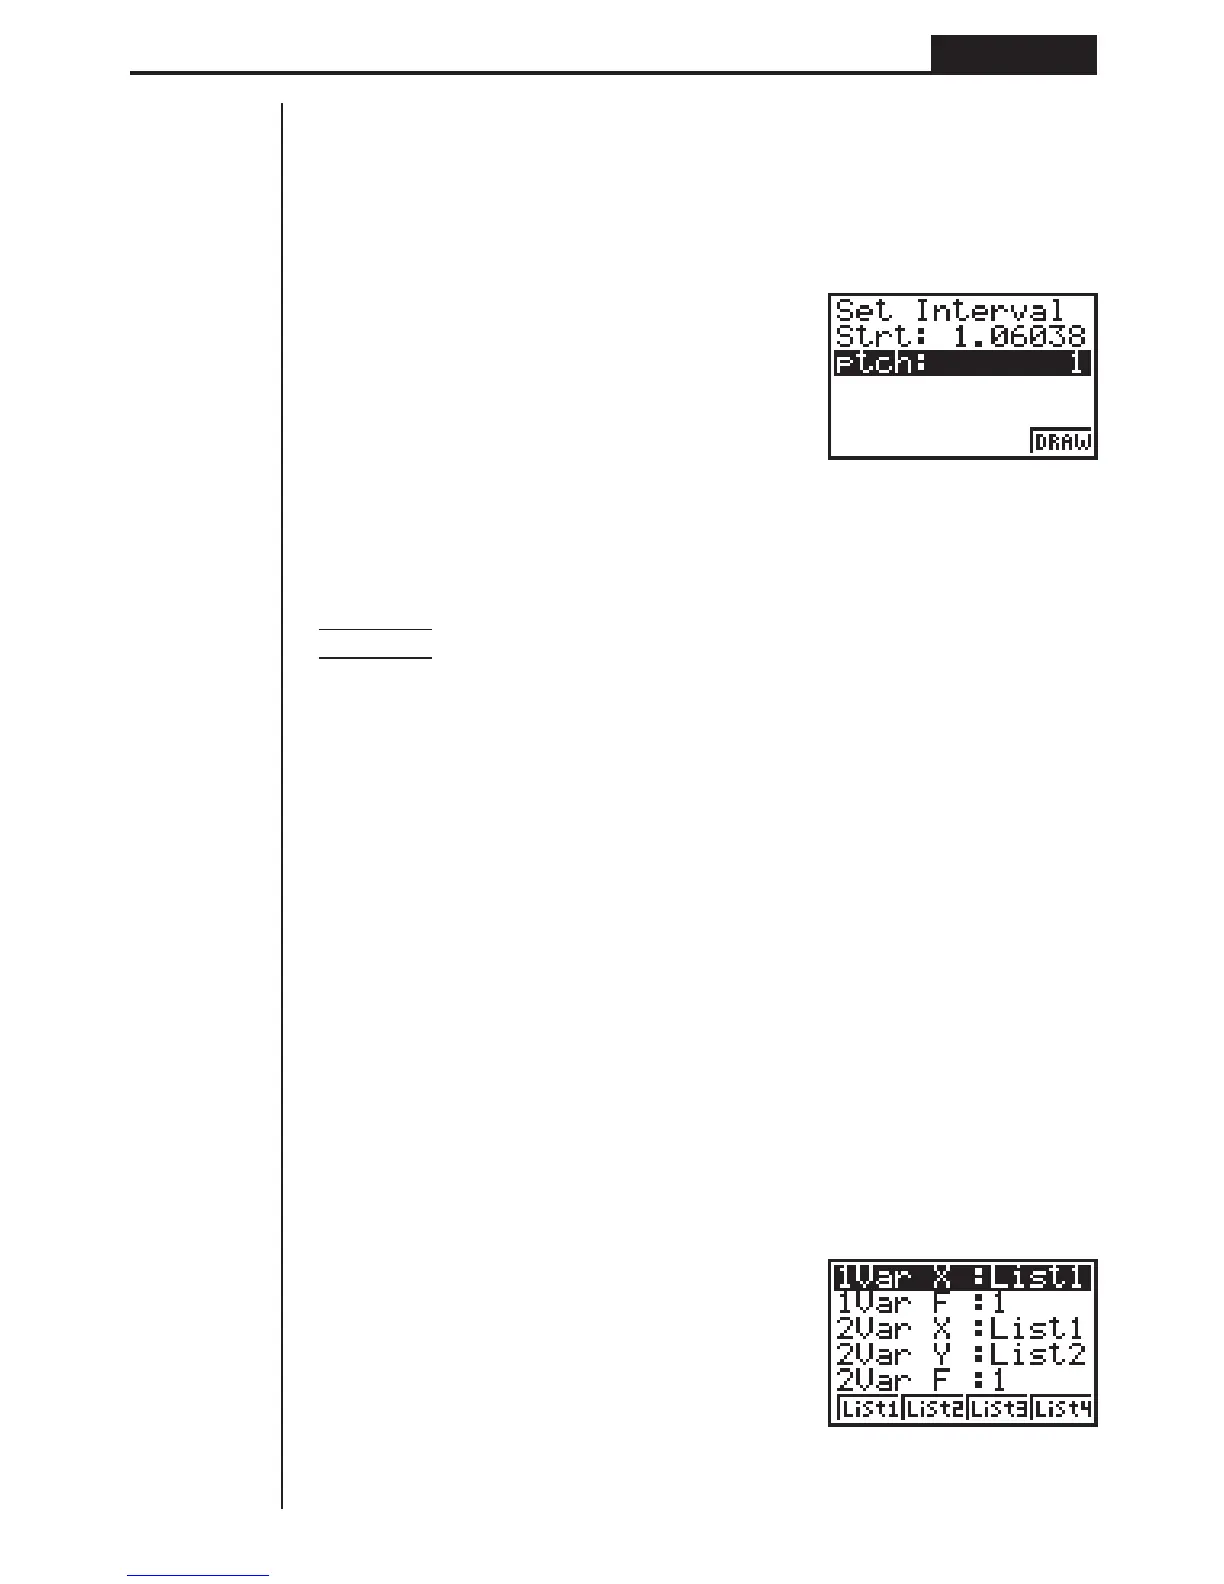
Strt .................. Histogram start point (
x-coordinate)
ptch ................. Bar spacing (specify as scale unit)
Example Strt: 0, ptch: 10
While the statistical data list is on the display, perform the following procedure.
!Z2(Man)
Q(Returns to previous menu.)
1(GRPH)1(GPH1)
aw(Start value is
x = 0.)
baw(pitch = 10)
6. Performing Statistical Calculations
All of the statistical calculations up to this point were performed after displaying a
graph. The following procedures can be used to perform statistical calculations alone.
uu
uu
uTo specify statistical calculation data lists
You have to input the statistical data for the calculation you want to perform and
specify where it is located before you start a calculation. While the statistical data is
on the display, perform the following procedure.
2(CALC)4(SET)
 Loading...