55
Graphing Chapter 4
Use the following View Window parameters.
Xmin = –5 Ymin = –5
Xmax = 5 Ymax = 5
Xscl = 1 Yscl = 1
ccc
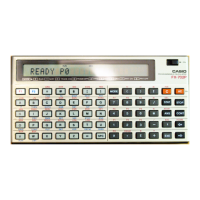
(Select a memory area that contains a
function for which you want to specify
non-draw.)
1(SEL)
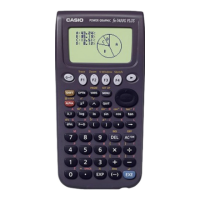
(Specify non-draw.)
4(DRAW) or w
(Draws the graphs.)
•Pressing u or A returns to the Graph Function Menu.
•A parametric graph will appear coarse if the settings you make in the View
Window cause the pitch value to be too large, relative to the differential be-
tween the min and max settings. If the settings you make cause the pitch value
to be too small relative to the differential between the min and max settings, on
the other hand, the graph will take a very long time to draw.
4. Drawing Graphs Manually
After you select the RUN icon in the Main Menu and enter the RUN Mode, you can
draw graphs manually. First press ! 4 (SKTCH) 2 (GRPH) to recall the Graph
Command Menu, and then input the graph function.
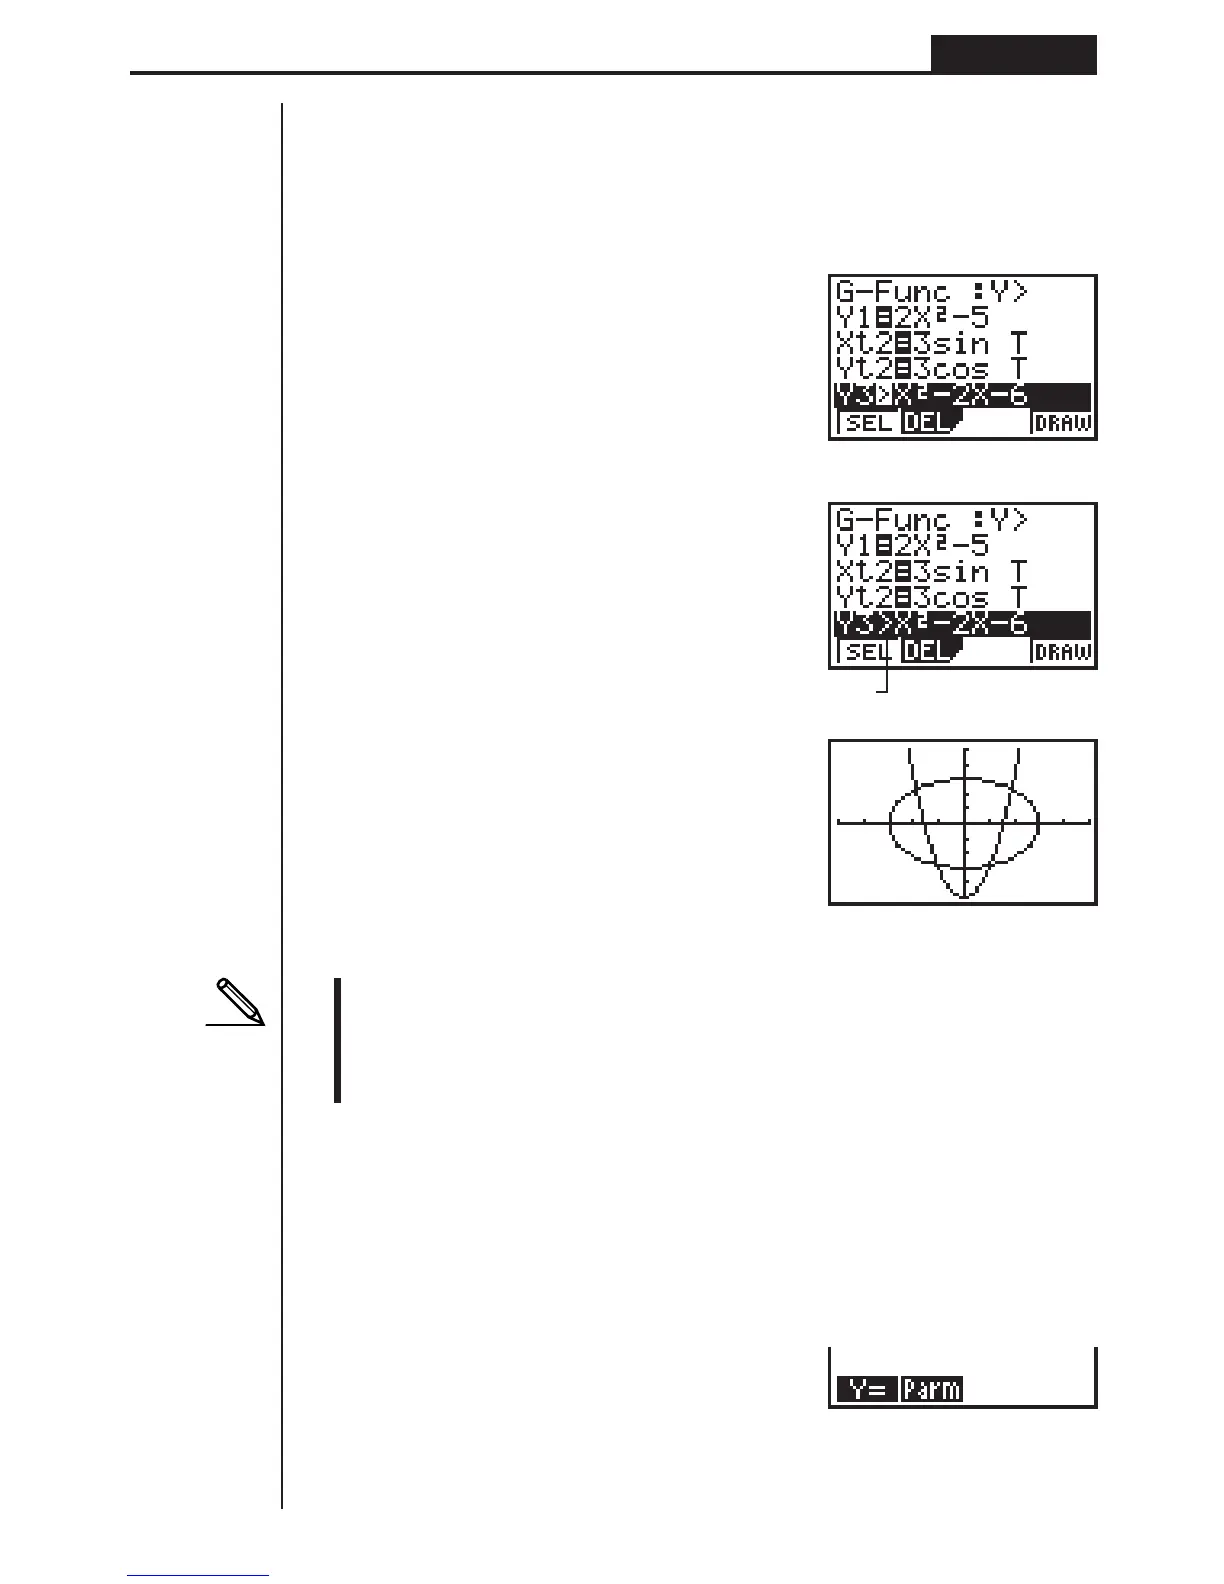
!4(SKTCH)2(GRPH)
1 (Y =) ......... Rectangular coordinate graph
2(Parm) ....... Parametric graph
1 234
1234
1234[
Unhighlights
 Loading...