65
Graphing Chapter 4
1 2 34[
1234[
1234[
• The above procedure automatically converts the
x-range and y-range View Win-
dow values to 1/5 of their original settings.
•You can repeat the factor zoom procedure more than once to further enlarge or
reduce the graph.
uu
uu
uTo initialize the zoom factor
Press !
2 (ZOOM) 2 (FACT) 1 (INIT) to initialize the zoom factor to the
following settings.
Xfct = 2 Yfct = 2
•You can use the following syntax to incorporate a factor zoom operation into a
program.
Factor <X factor>, <Y factor>
•You can use factor zoom for any type of graph.
kk
kk
k Sketch Function
The sketch function lets you draw lines and graphs on an existing graph.
•Note that Sketch function operation in the STAT, GRAPH or TABLE Mode is
different from Sketch function operation in the RUN or PRGM Mode.
uu
uu
uBefore using the Sketch Function
Press ! 4 (SKTCH) to display the sketch menu.
In the STAT, GRAPH or TABLE Mode
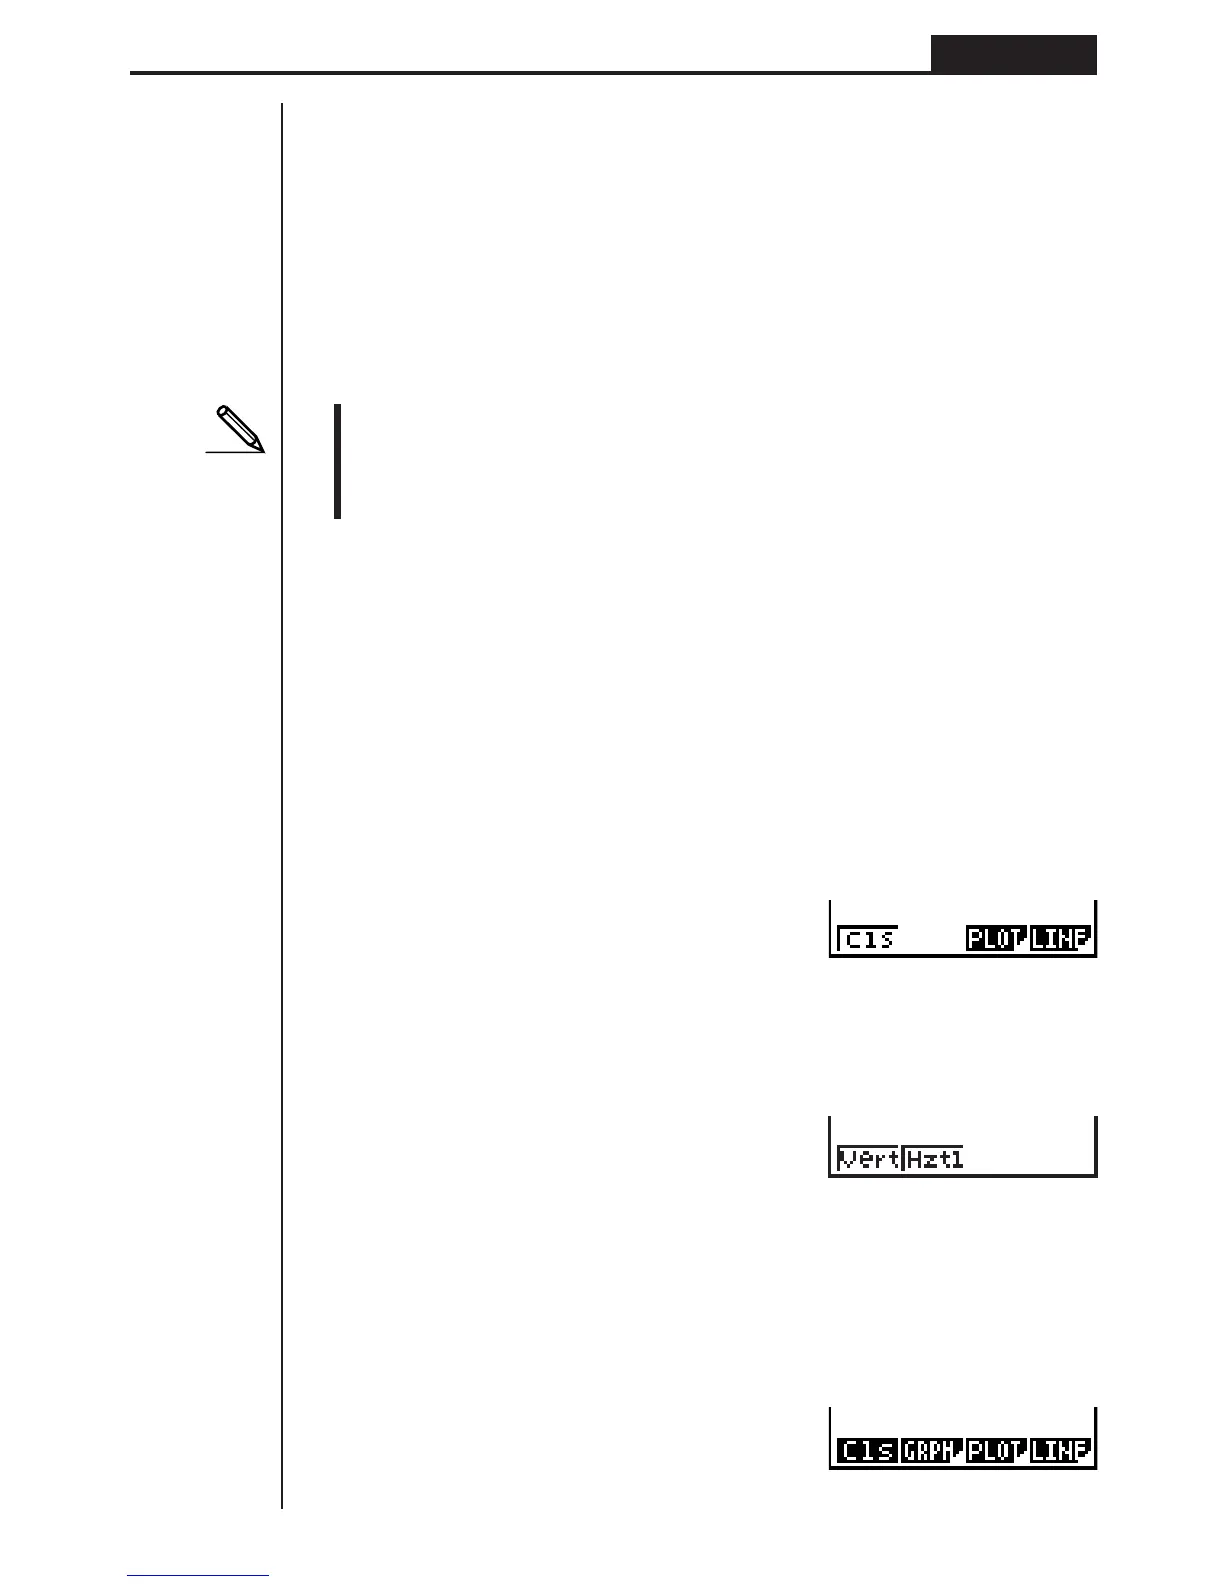
!4(SKTCH)
1 (Cls) .......... Clears drawn line and point
3 (PLOT)...... Displays plot menu
4 (LINE) ....... Displays line menu
[
1 (Vert) ........ Vertical line
2 (Hztl) ......... Horizontal line
Press [ to return to the previous menu
In the RUN or PRGM Mode
!4(SKTCH)
 Loading...