Version 1.0, 11/2017. Copyright 2012 Hitron Technologies
38
Version 1.0, 11/2017. Copyright 2017 Hitron Technologies
38
Hitron E31N2V1 User’s Guide
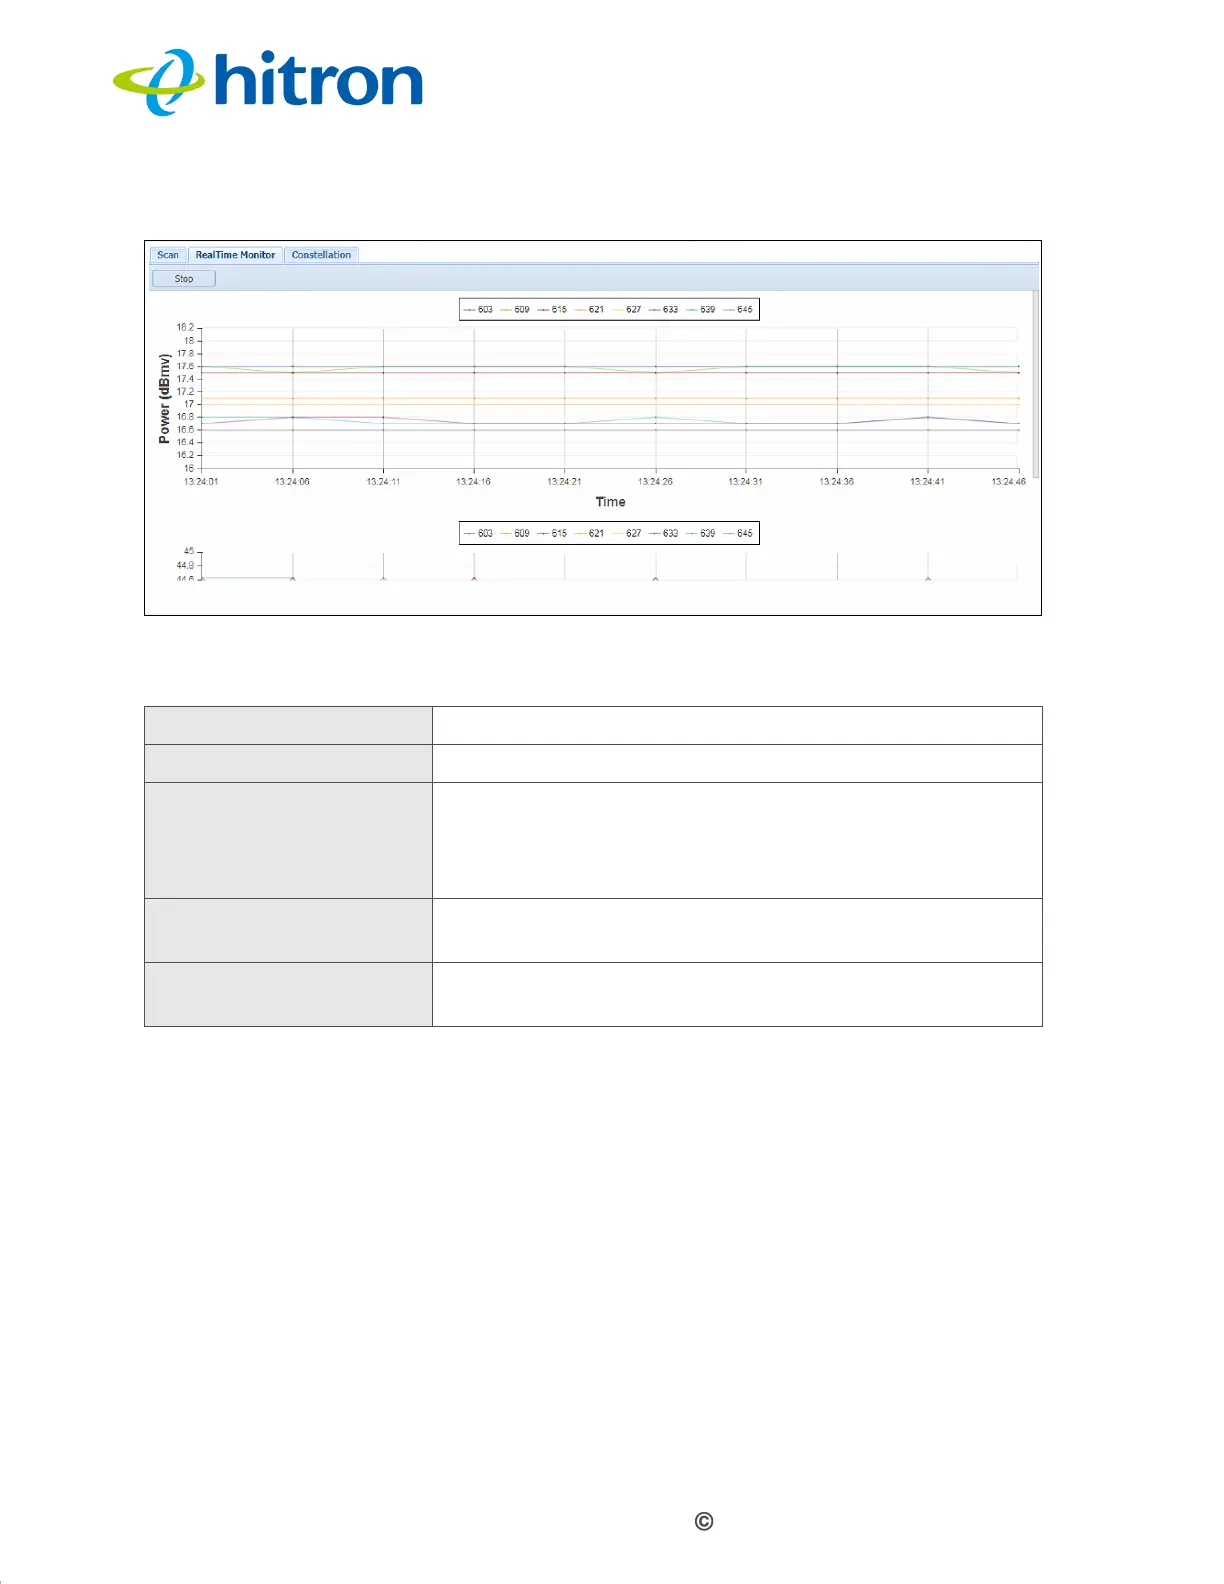
Figure 8: The Spectrum RealTime Monitor Screen
The following table describes the labels in this screen.
1.7.3 The Spectrum Constellation Screen
Use this to view a representation of the digitally-modulated RF signal, depicted as a
two-dimensional scatter diagram. You can use this diagram to troubleshoot RF
communication issues by identifying signal interference and/or distortion.
Click the Constellation tab in the System: Spectrum screen. The following screen
displays.
Table 10: The Spectrum RealTime Monitor Screen
Start Click this to begin monitoring.
Stop Click this to end monitoring.
(Index) The graph displays a differently-colored line for each of
the frequencies on which the E31N2V1 is
communicating on the RF network. The index lets you
know which color line represents which frequency.
Power (dBmV) This displays the power of each channel, in decibels
relative to one millivolt.
Time This displays the system time at which the power
measurement was taken.
 Loading...