Version 1.0, 11/2017. Copyright 2012 Hitron Technologies
39
Version 1.0, 11/2017. Copyright 2017 Hitron Technologies
39
Hitron E31N2V1 User’s Guide
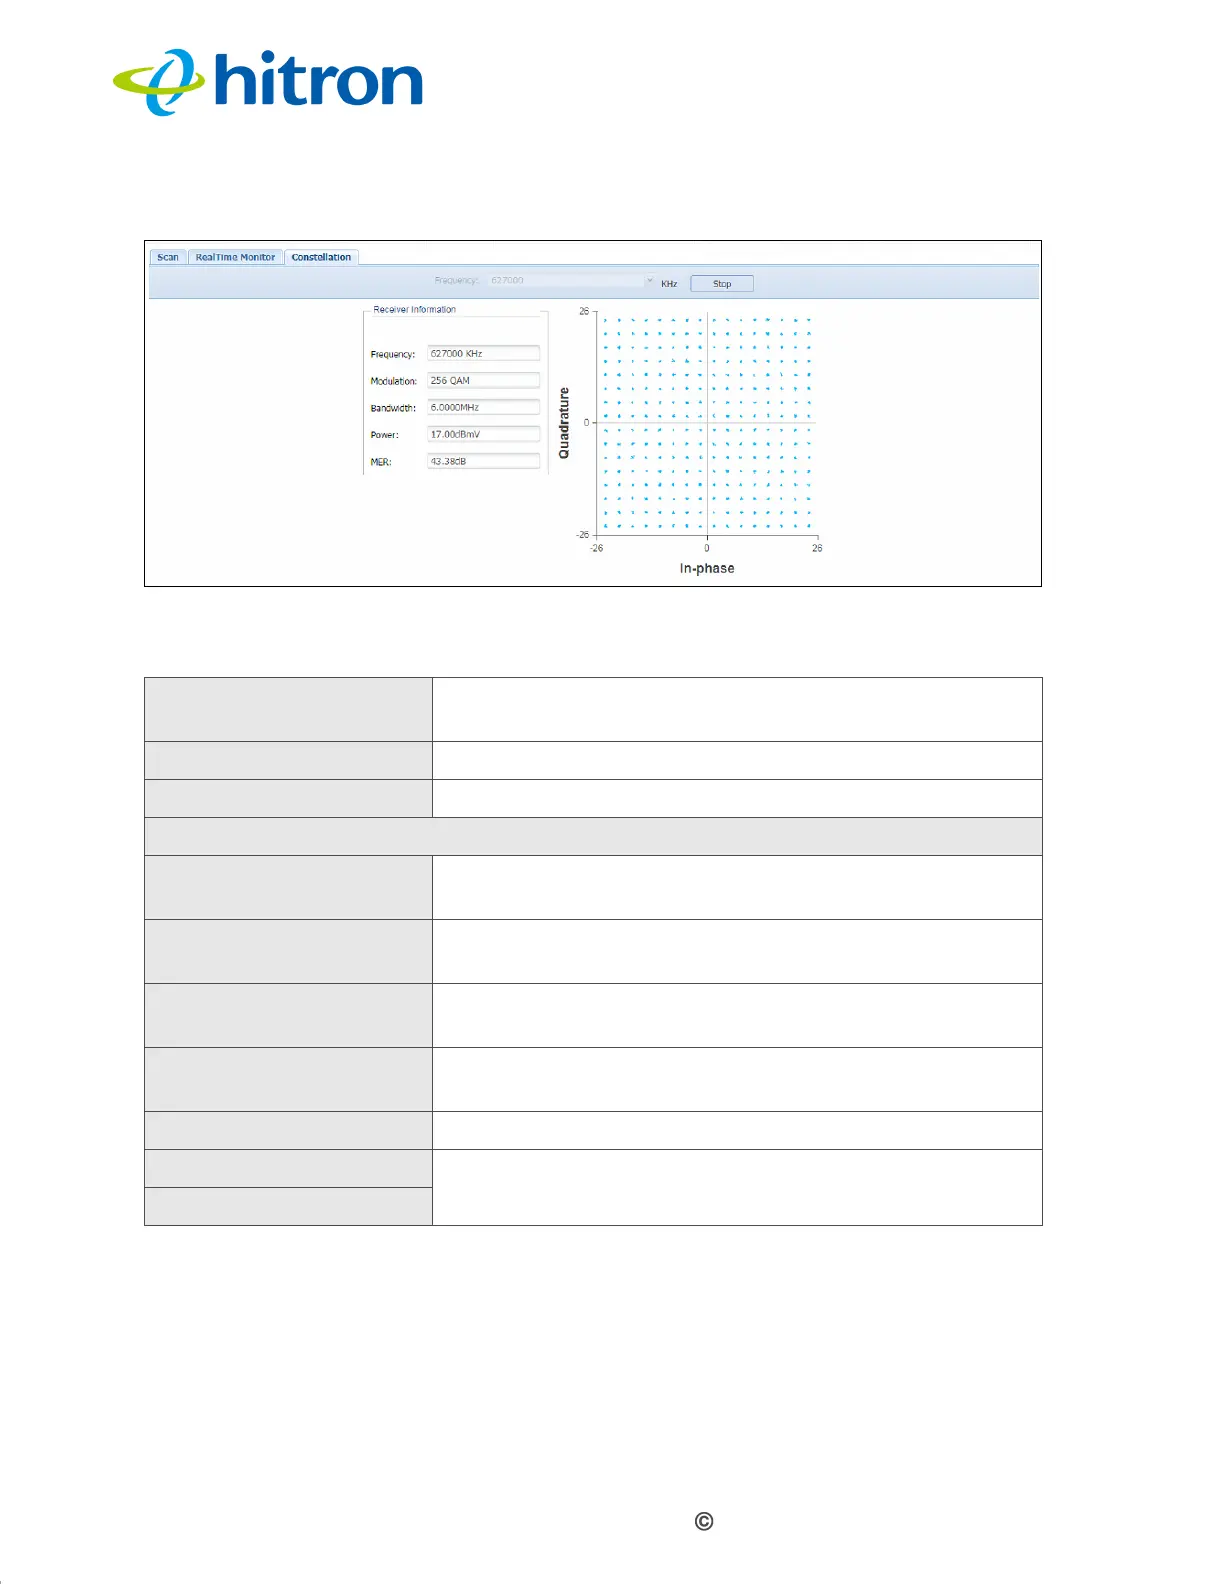
Figure 9: The Spectrum Constellation Screen
The following table describes the labels in this screen.
1.8 The Status: MTA Line Status Screen
Use this screen to see general information about the E31N2V1’s embedded
Multimedia Terminal Adapter module.
Table 11: The Spectrum Constellation Screen
Frequency Select the frequency of the RF signal you want to
monitor.
Start Click this to begin monitoring the selected Frequency.
Stop Click this to end monitoring.
Receiver Information
Frequency This displays the frequency of the signal currently being
monitored.
Modulation This displays the type of modulation being used on the
monitored signal.
Bandwidth This displays the channel width of the signal currently
being monitored.
Power This displays the measured power of the signal currently
being monitored, in decibels relative to one millivolt.
MER This displays the Modulation Error Ratio.
Quadrature This diagram displays the measured spectrum
constellation.
In-Phase
 Loading...