List Function
Copyright ©ITECH Electronic Co., Ltd. 62
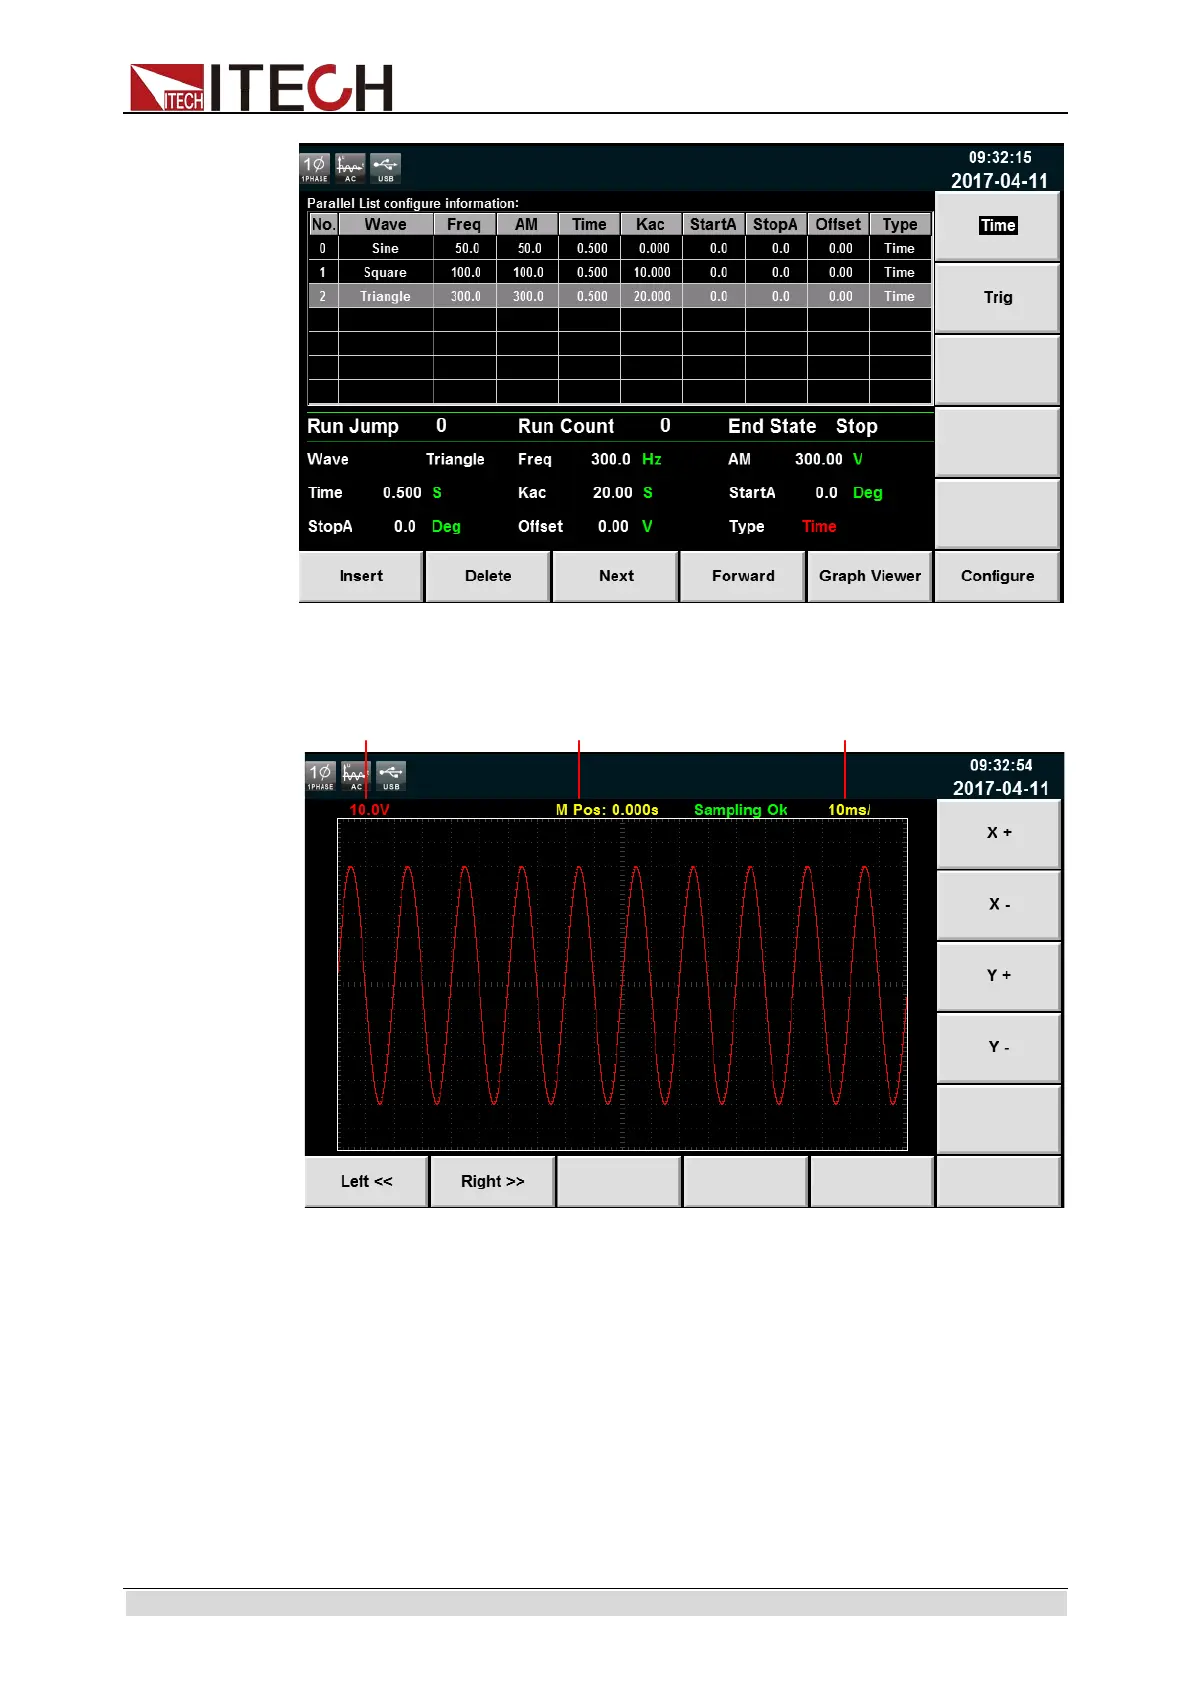
5. Press [Graphy Viewer] to draw the waveform according to the configured
parameters, as shown in the figure below.
X+/ X-: Increase/decrease the time grid.
Y+/ Y-: Increase/decrease the voltage grid.
Left<</ Right>>: If the waveforms cannot be completely displayed in the
present screen, move the waveform leftward/rightward or operate the knob at
the front panel.
6. After editing, Press [Esc] to go back to the previous interface, press
[Shift]+[Recall] (Save) on the front panel to save the file in the name
“List01 csv” (example).Press [Enter] to confirm.
7. Press [Esc] to go back to the previous interface. The configured “List01
csv” file will appear in the interface, as shown by the red box below.
ООО "Техэнком" Контрольно-измерительные приборы и оборудование www.tehencom.com
 Loading...