Mimosa Client Help Content
Mimosa Clients Channel & Power
Copyright © 2014 Mimosa Page 46
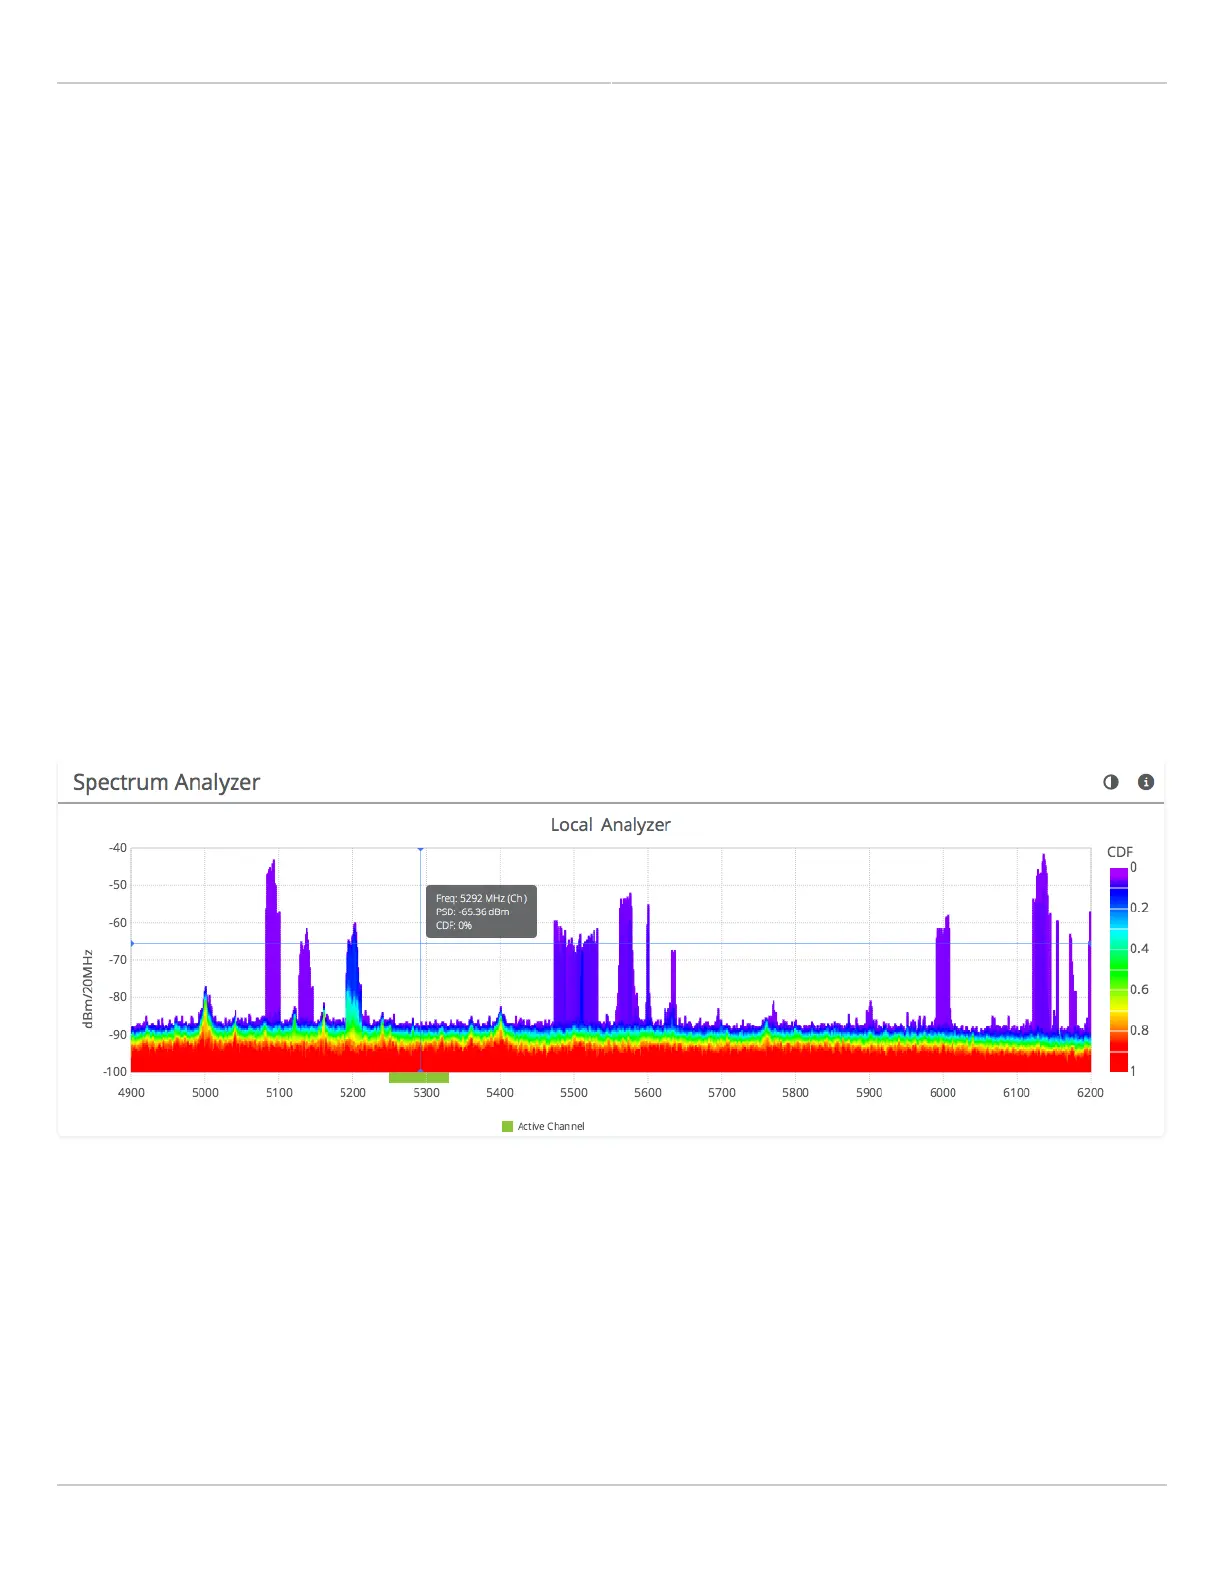
Reading the Spectrum Analyzer
The Spectrum Analyzer actively scans the spectrum in the background to report on interference sources that may
impact link performance. Click on the half circle icon in the upper right to toggle the graph's background color
between black and white.
Channels in use have higher Power Spectral Density (PSD), or amplitude, on the vertical axis, and are shaded in
different colors to represent how often the signals are likely to be on the same frequency at the same amplitude.
The legend to the right of the graph explains the color code for the Cumulative Distribution Function (CDF). The
color red suggests the highest probability (1 = 100%), while purple represents the lowest probability (0 = 0%).
Cross hairs appear on the graph beneath the mouse pointer along with an information box containing the frequency
(channel), PSD, and CDF values.
There are three types of markings, or bars, immediately beneath the graph’s horizontal axis that indicate frequency
ranges that are restricted, manually excluded, or in active use by this link. Note that traffic from the Active Channel
is excluded from the display so that noise can be detected.
 Loading...