Warning
Please Note
The specifications of the product detailed on this
Set-Up Guide may change without notice. RDM
Ltd. shall not be liable for errors or for incidental
or consequential damages, directly and indirectly,
in connection with the furnishing, performance or
misuse of this product or document.
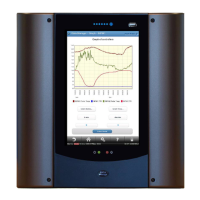
This feature will display the control values for a device on a
dedicated scrolling graph which will update in real-time. The
dmTouch will select up to the first four "Control values" it
can automatically identify. If it can, it will preferentially select
Air-on, Air-off, Suction and Evaporator temperatures
(Suction & Discharge pressures for pack controllers).
If the dmTouch can identify Alarm High/Low limits or
Over/Under temperature limits, it will draw these as shaded
red bands on the graph.
The user can also temporarily hide certain traces by clicking
on the name of the control value beneath the graph.
The scrolling update will refresh the data every 15
seconds*. The graph is time stamped and the traces are
‘selectable’ by clicking on the names.
Note: If the dmTouch fails to automatically identify any
control values for a given device, then this feature will not
be displayed.
For more details on control value identification, please
consult RDM technical support.
* 15 seconds is the minimum update period and is
dependent on the product and network type in use. For
example the wireless battery probe only updates its
temperature value every 10 minutes, therefore the feature
will update the data every 15secs but the user would only
see values change every 10min.
Note: If there is a device mimic configured and dynamic
graphing is available, then the user can swipe left and right
to navigate between views.
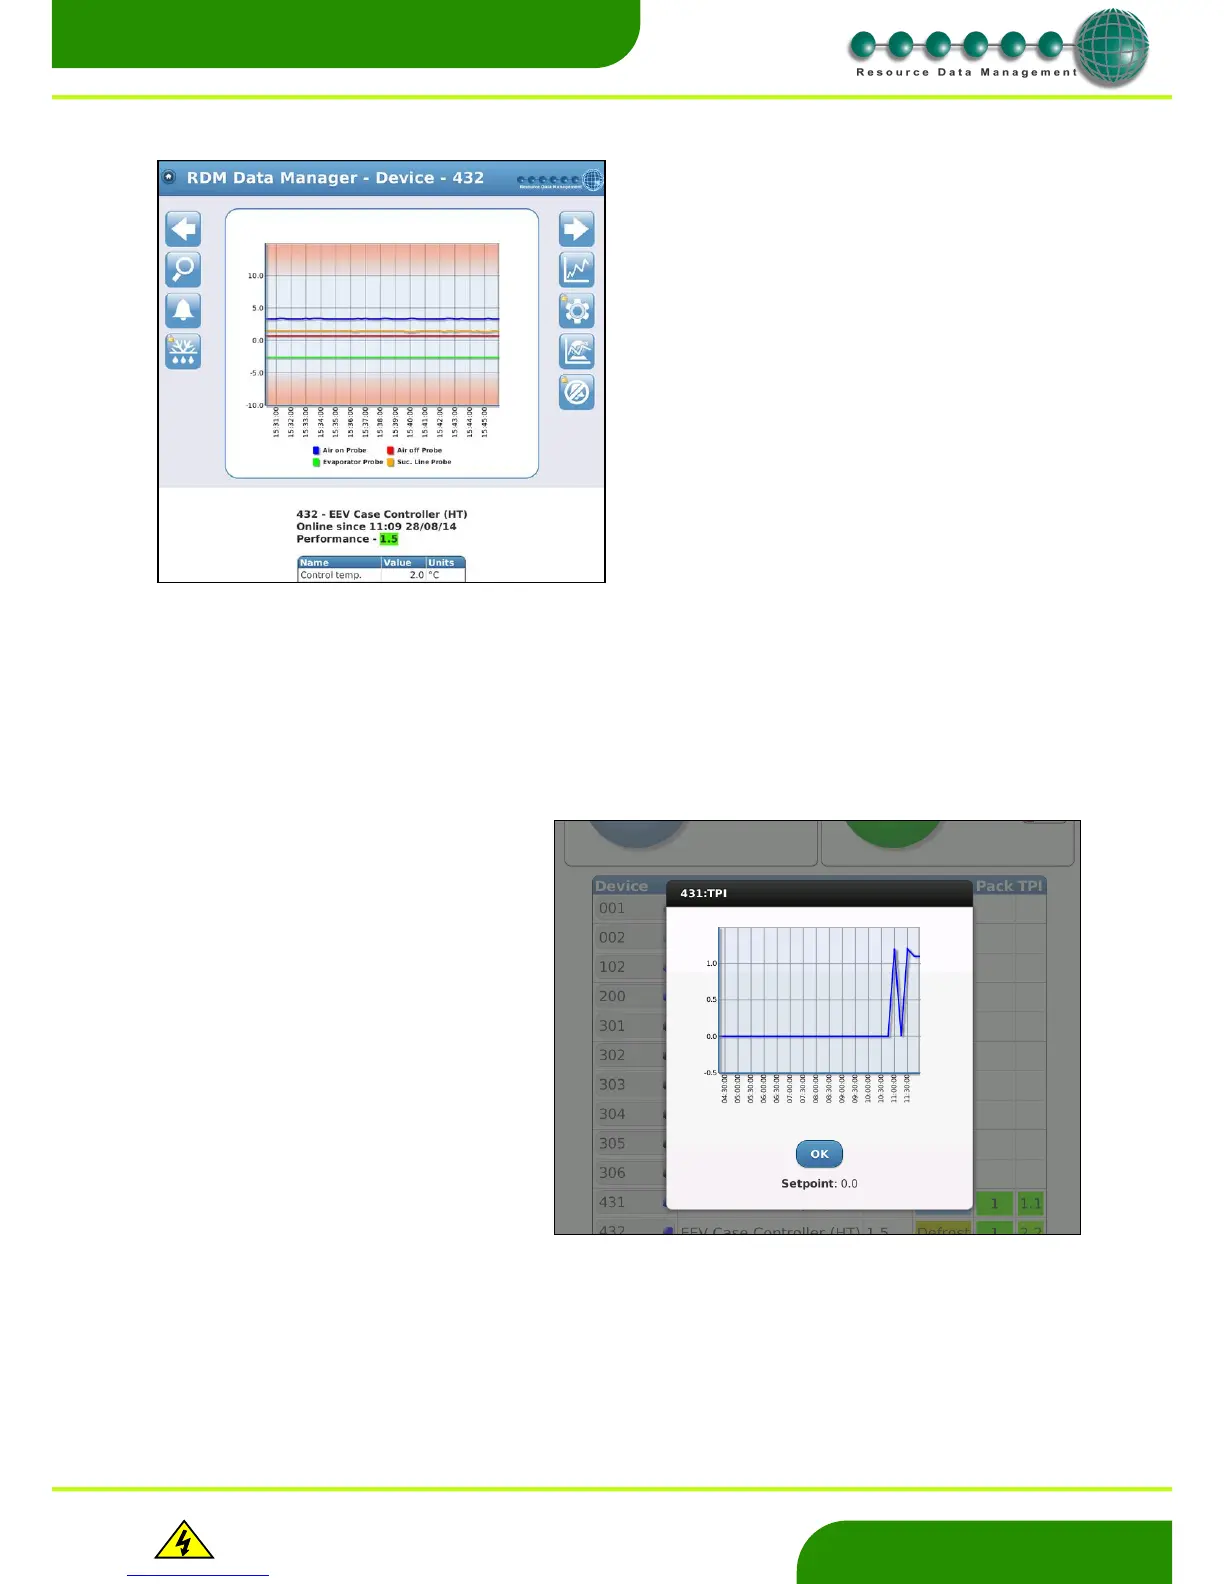
From the Device list, the user can press on
the TPI value* to view the trace of the
device’s TPI over the last 7hrs. The graph
will update every 30min. Below the graph it
will show you the device’s set point.
*TPI relates to the Temperature
Performance Indicator and requires to be
both enabled and configured for the
devices.
Note: the update refresh time period is
30min.
 Loading...