www.ti.com
Using the EVM
13
SBAU309A–February 2018–Revised June 2018
Submit Documentation Feedback
Copyright © 2018, Texas Instruments Incorporated
OPT3101 Evaluation Module
5.4 Using Latte Software
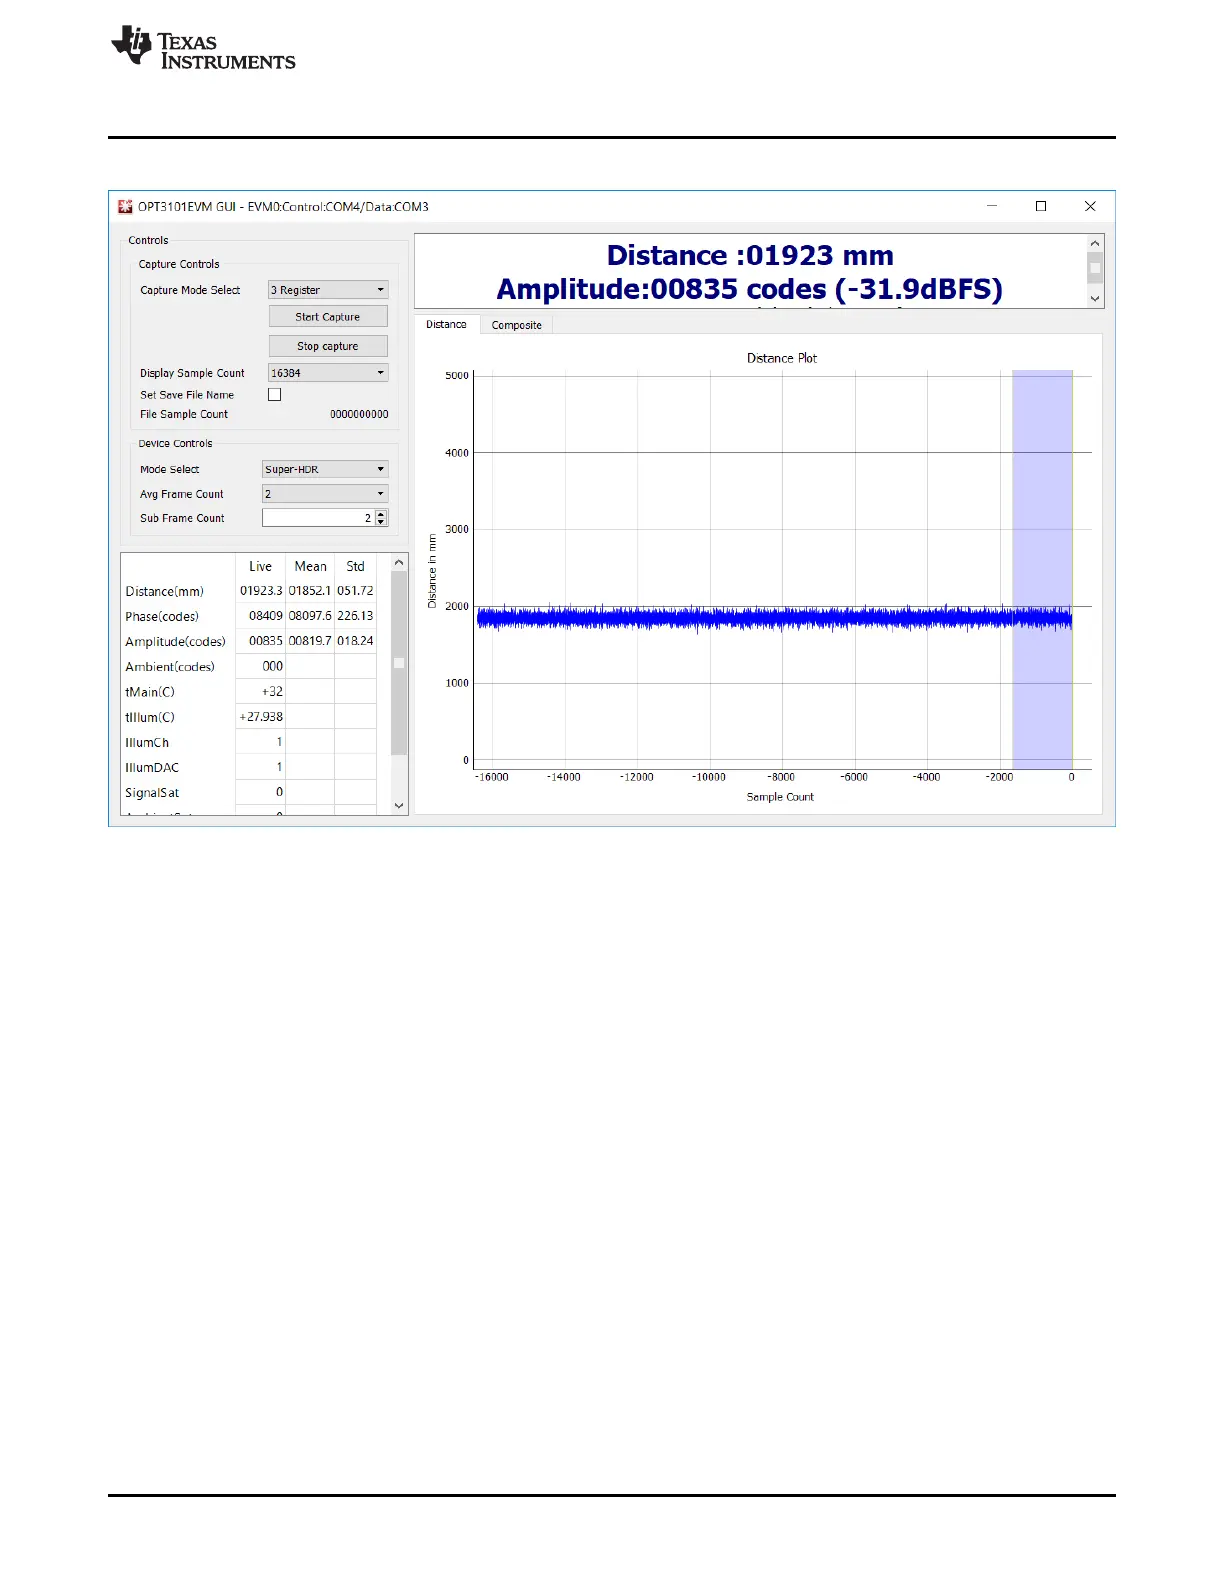
Figure 15. Gui Window
Clicking the Start Capture button begins capture. This sends a capture start command over the OPT3101
Control Port to the MSP430 on the EVM. The EVM then begins streaming data over the OPT3101 Data
Port. This data is displayed live on the left side of the window. Distance is plotted on the graph. The axis
of the plot can be changed by right clicking on the plot itself.
Clicking the Stop Capture button, or closing out the window stops streaming data from the EVM.
A number of key measurements are provided on this GUI. Distance, phase, amplitude, ambient, and
temperature as well as a number of other parameters are all calculated internally on the OPT3101 and
transmitted via I
2
C to the MSP430 and then to the PC over the data COM port. These values are all
displayed in the table on the left hand side of the GUI window and summarized in Table 3.
Frame Averaging
The Sub Frame Count and Avg Frame Count settings shown on the left of the GUI can be adjusted to
decrease measurement noise or increase speed of measurement. An increase in avg frames will decrease
the standard deviation in measurements while a decrease in avg frames will increase the data collection
rate. Please note that these two fields correspond directly to register settings and Sub Frame Count must
be greater than or equal to Avg Frame Count. An Avg Frame Count value of 0 corresponds to no
averaging.
 Loading...