Chapter 2: TI-83 Plus Specific Information 73
TI-83 Plus Developer Guide Third Release May 28, 2002
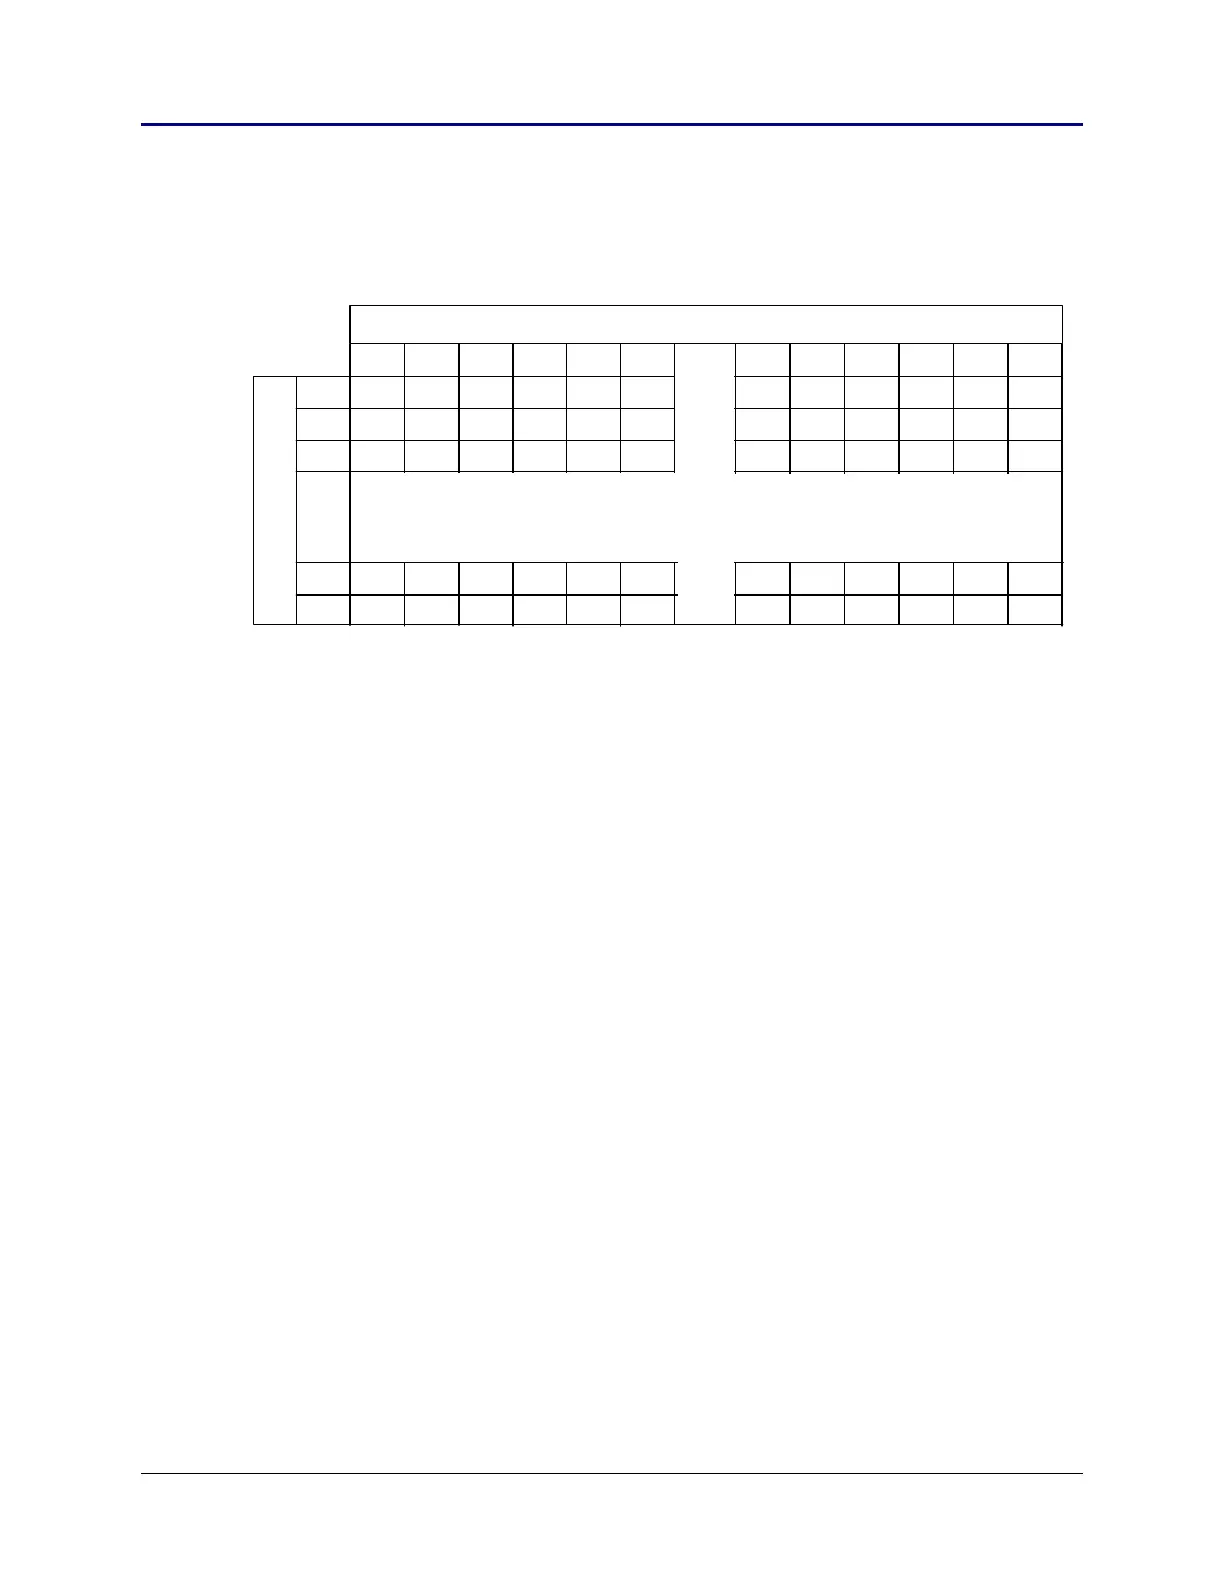
• Pen Display Mapping
This mapping is based on individual pixel locations. It is used mainly in the graph
context for displaying text on a graph, but is also used in the statistics edit context to
display list elements. The display is mapped out to 64 rows of 96 pixels.
012345
90 91 92 93 94 95
0
1
2
.
.
.
62
63
penRow
...
...
...
...
.
.
.
...
...
penCol
Fig. 2.10: Pen Display Mapping
– Two bytes of RAM are used to position text written:
• (penCol) = column coordinate (0 – 95d)
• (penRow) = row coordinate (0 – 63d)
The pen location specified represents the upper left most pixel of the character
being displayed.
– Fonts
• 5 (width) x 7 (height) (pixels) large characters.
• 6/7 pixel high by variable-width small characters.
• Application defined custom characters.
– Text formatting
• Reverse video:
Display all text written in reverse video:
textInverse, (IY + textFlags); default = 0
• Write to Graph backup buffer:
The output can be directed to either the display, or the graph backup buffer,
plotSScreen.
textWrite, (IY + sGrFlags) = 1 to write to buffer; default = 0