WAVECOM Decoder W74PC, W-PCI/e, W-CODE, W-CLOUD Manual V9.1.0 Classifier (Optional)
277
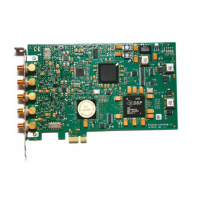
Frequency transitions are displayed along a time axis. The values of the frequencies of the
MFSK signal are displayed on the vertical axis.
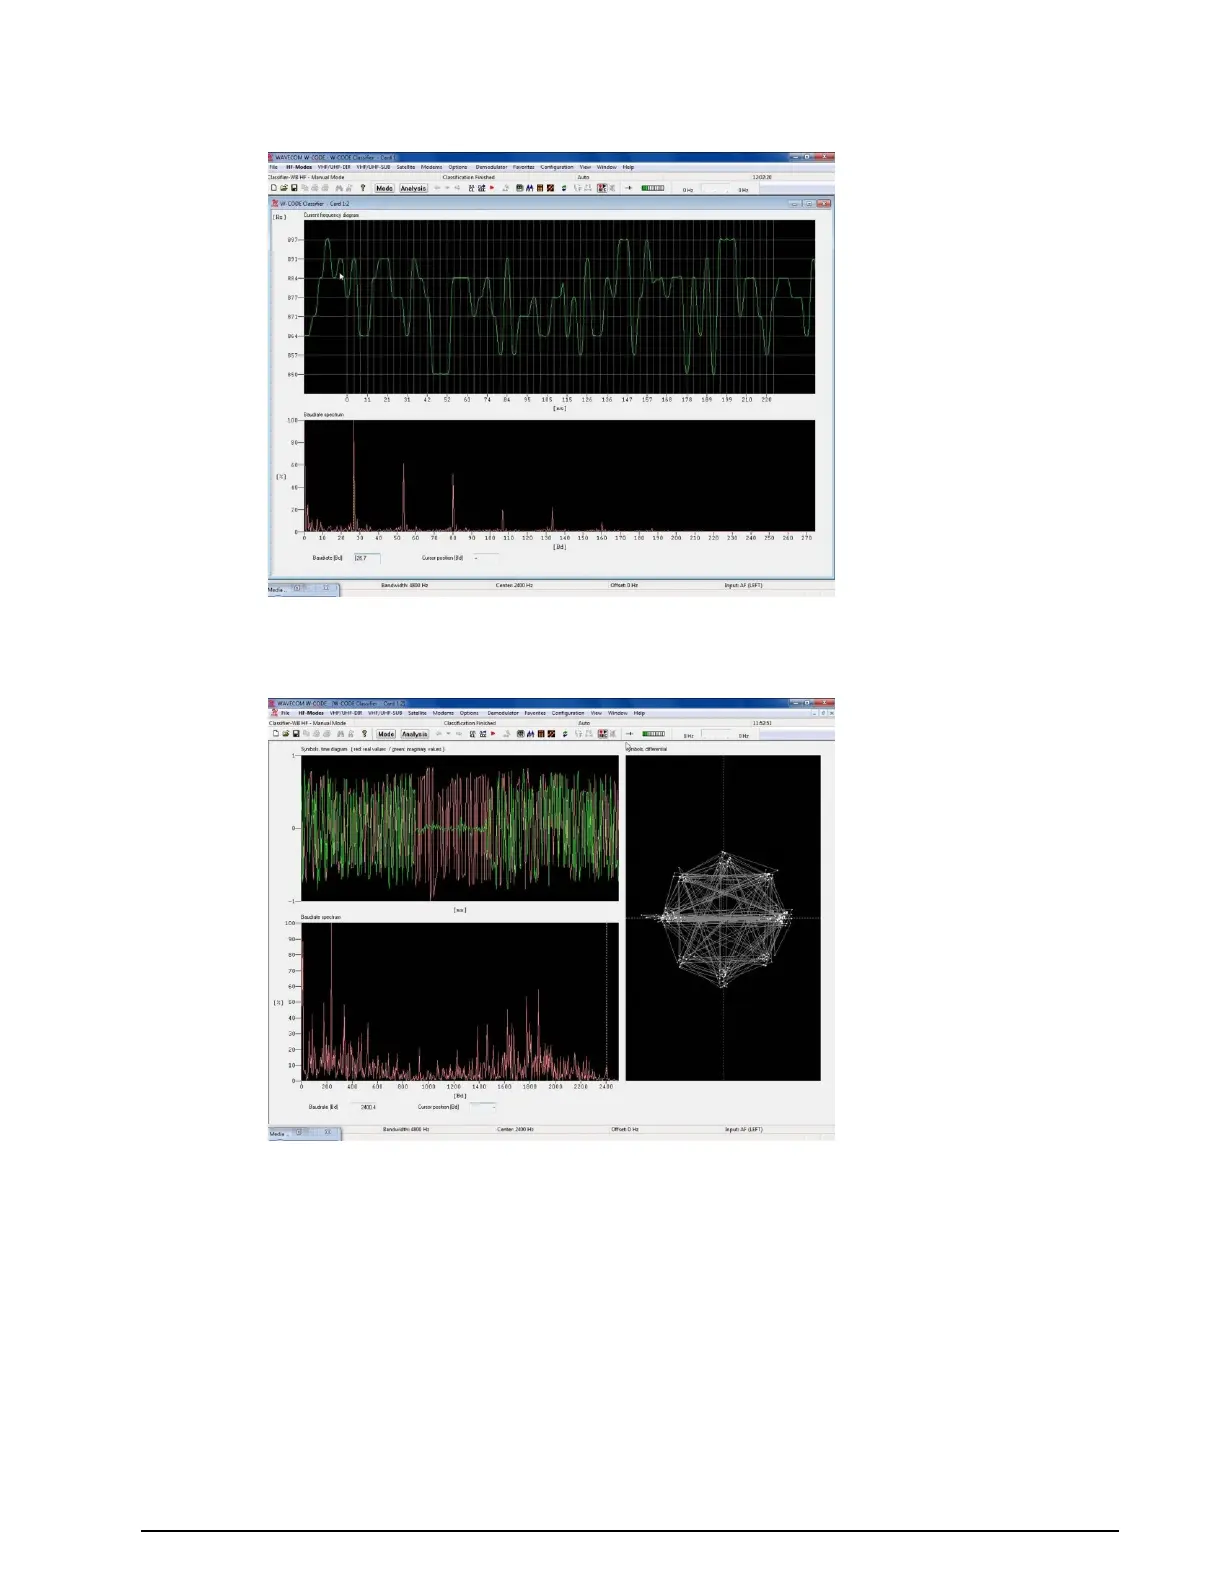
Phase transitions are displayed along a time axis – the red graph shows the value of the real
component of the signal (the I component) and the green graph shows the value of the im-
aginary component of the signal (the Q component).
Baudrate Spectrum
This pane displays a probability spectrum of the instantaneous baud rates contained in the analyzed sig-
nal. The value of the highest probable rate is marked by a vertical, dotted marker and numerically dis-
played in a Baudrate box below the pane.
Moving the mouse cursor across this pane changes the cursor into a crosshair, which can be used to de-
termine the baud rate for individual spectral components. The baud rate value pointed to by the crosshair
is displayed in a Cursor position box below the pane.
Symbols, differential
Phase plane display showing the differential phase constellation of the signal. This pane is only available
for PSK signals.
 Loading...