19
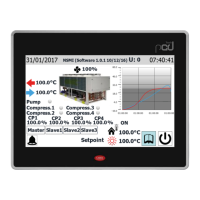
7 DIAGRAM MENU
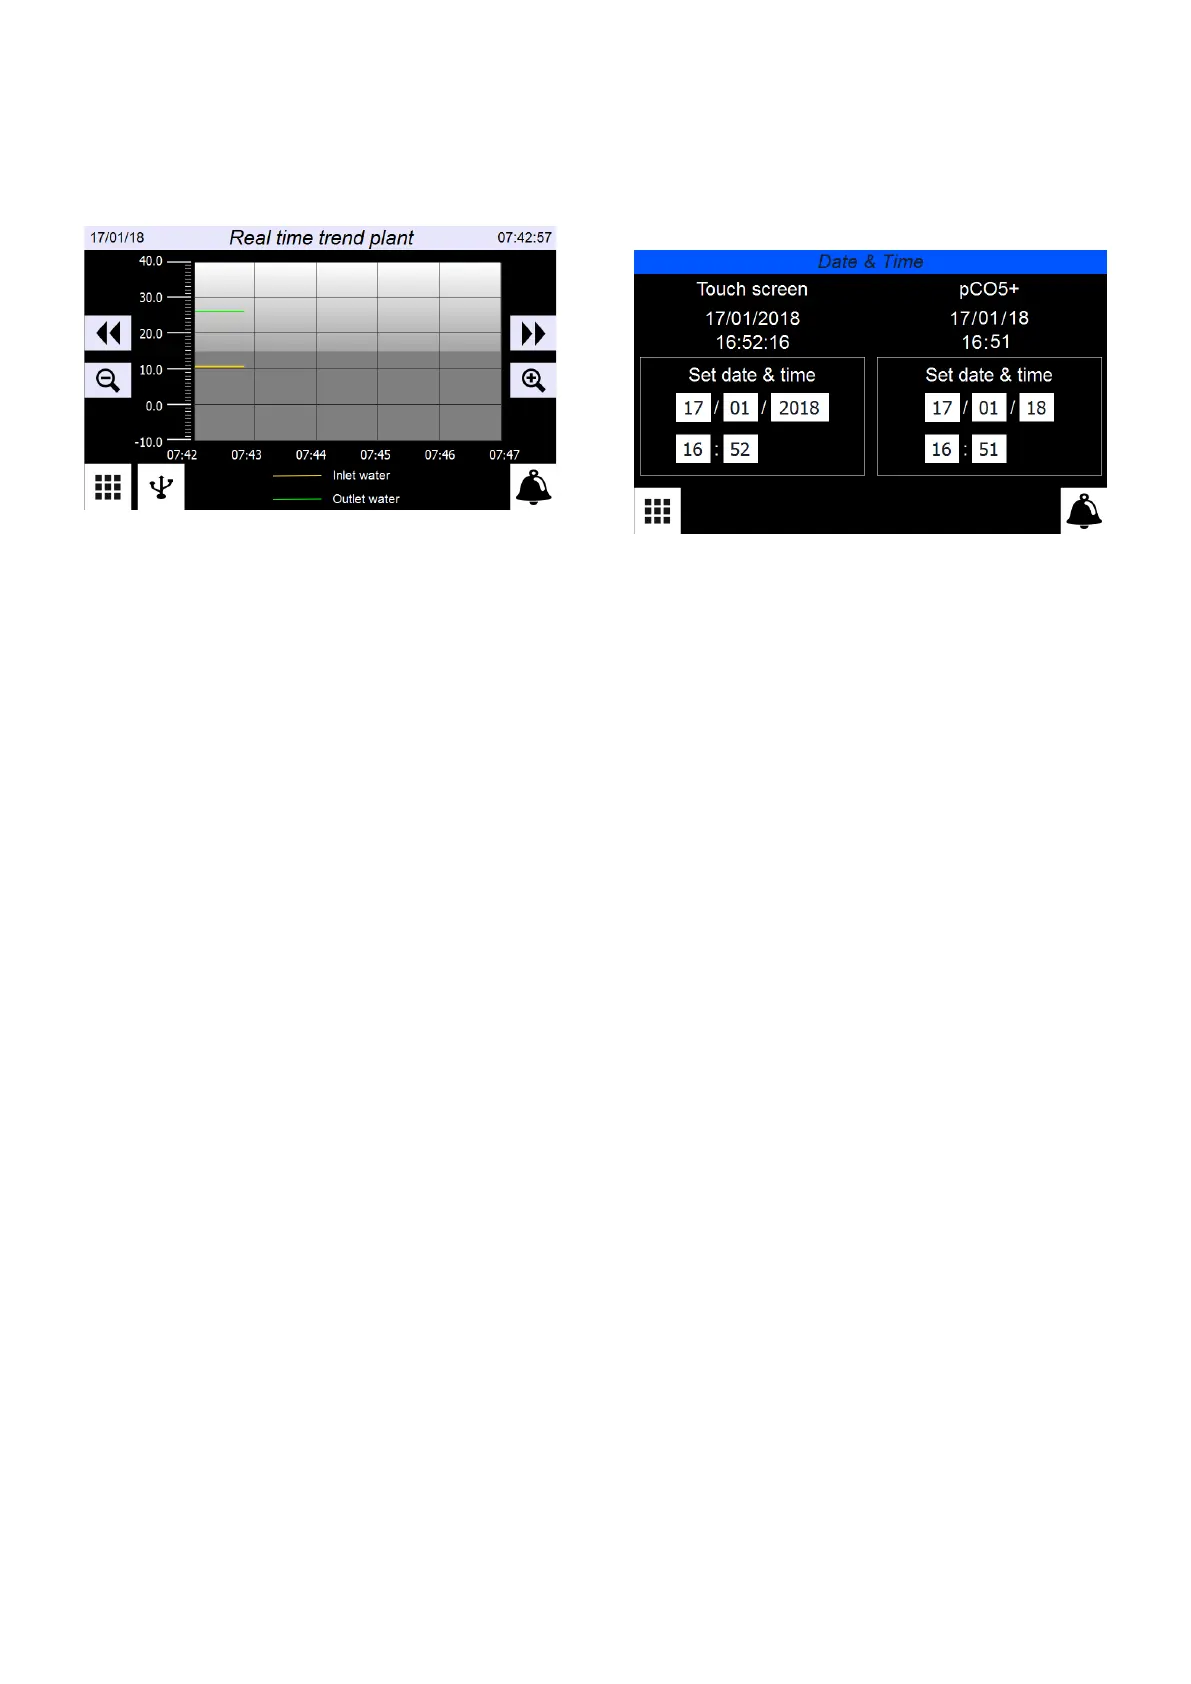
Through the GRAPHS menu it is possible to display, in real-time, the graph of the
evaporator inlet and outlet temperature probes.
7.1 GRAPHS IN REAL TIME
— Indicates system date
— Indicates system time
— Saves the data stored in memory (4000 pairs of evaporator inlet/outlet temper-
ature values, sampled every 10 seconds) on USB. This port is available behind
the touch screen
— Scrolls the graph backward along the X axis (time)
— Scrolls the graph forward along the X axis (time)
— Performs a negative zoom of the graph
— Performs a positive zoom of the graph
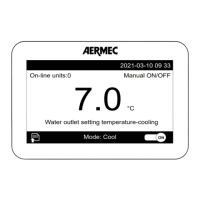
8 CLOCK MENU
With the CLOCK menu you can set the system timer (on the pCO5+ board) and the
display timer.
8.1 DATE AND TIME SETTINGS ON THE MAIN BOARD AND
ON THE TOUCH DISPLAY BOARD
— Indicates the actual date and time set on the touch display board timer
— Indicates the actual date and time set on the pCO5+ board timer
— Allows to adjust and/or modify the date and time on the touch display board
— Allows to adjust and/or modify the date and time on the pCO5+ board
 Loading...