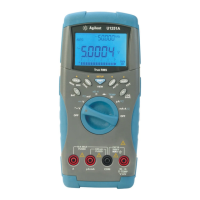
Introduction 1
Your Multimeter in Brief
U1231A/U1232A/U1233A User’s Guide 27
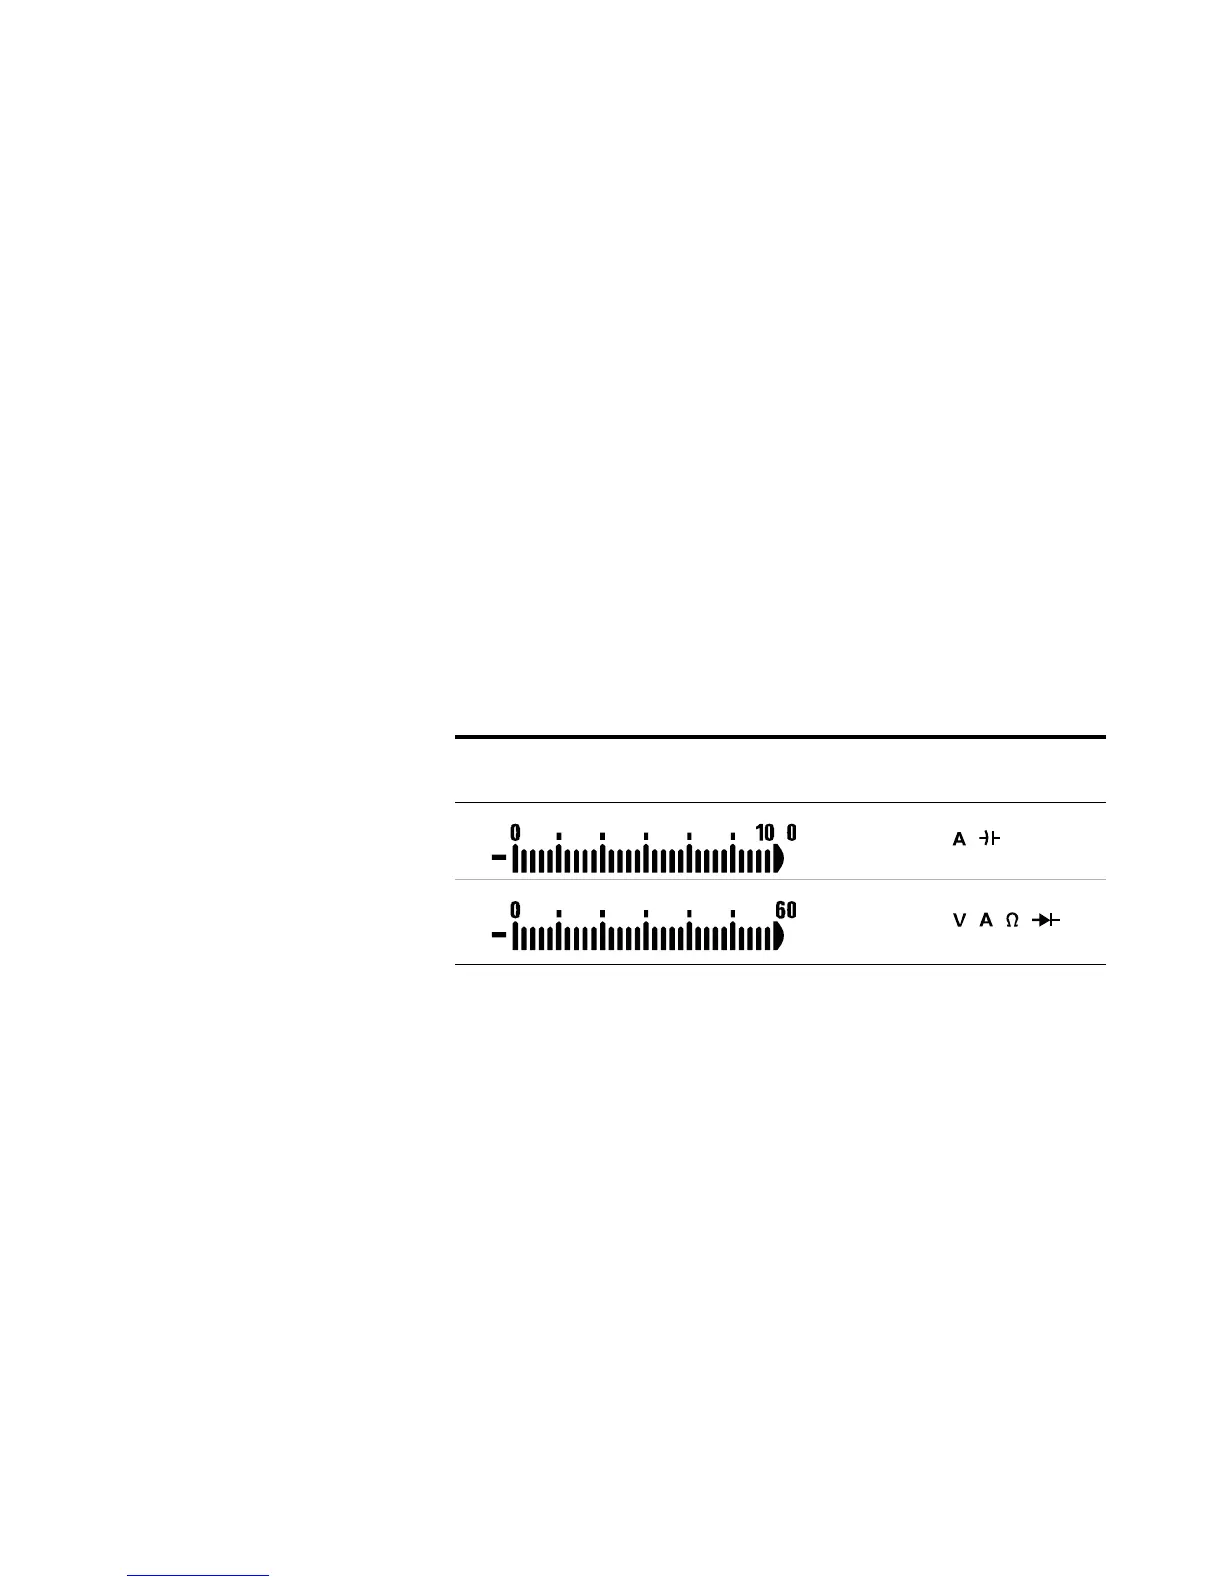
Analog bar graph
The analog bar emulates the needle on an analog multimeter,
without displaying the overshoot. When measuring peak or
null adjustments and viewing fast- changing inputs, the bar
graph provides a useful indication because it has a faster
updating rate
[1]
to cater for fast- response applications.
For example, when frequency is displayed on the primary
display during voltage or current measurement, the bar
graph represents the voltage or current value (not the
frequency value).
The “–” sign indicates whether the measured or calculated
value negative. Each segment represents 33.34 or 200 counts
depending on the range indicated on the peak bar graph.
An unstable bar graph and unmatched primary display when
measuring DC voltage usually means the presence of AC
voltages in the circuit.
[1] The analog bar graph display update rate is approximately 33 times/second for
DC voltage, current, and resistance measurements.
Tab le 1- 9 Analog bar graph display
Range Counts/
Segments
Used for the
function
33.34 ,
200 , , ,
 Loading...