1. OPERATION
1-15
2) Select [Graph], then push the ENTER knob.
4. Select [Graph Style], then push the ENTER knob.
5. Select [Horizontal] or [Vertical], then push the ENTER knob.
6. Press the MENU/ESC key several times to close the menu.
Note: To close the fish size histogram window, set [ACCU-FISH] to [Off]. When the
fish size histogram window is closed, all data measured for it is deleted.
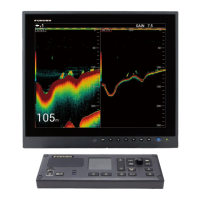
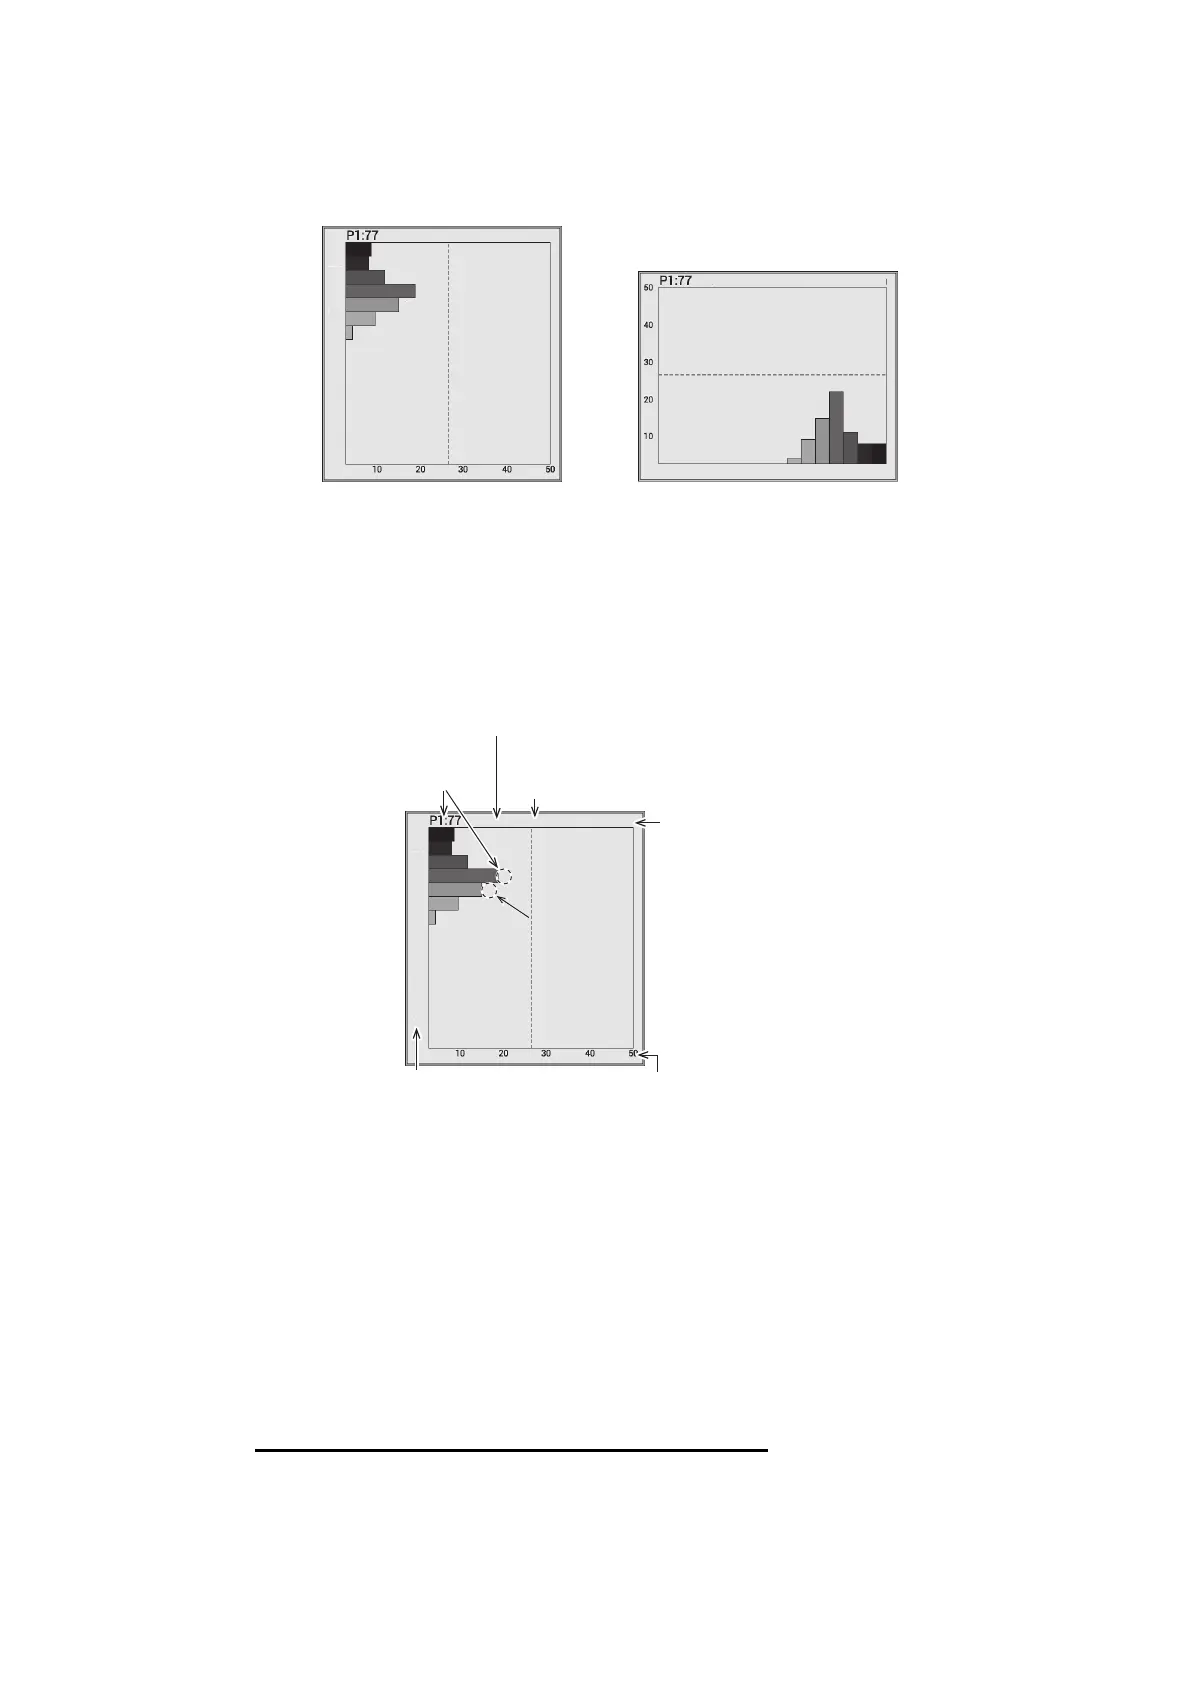
1.12.2 How to interpret the fish size histogram window
The fish size histogram is a bar graph that shows fish length and distribution within the
selected measuring area. In the fish size histogram window above, the following infor-
mation is shown.
• The most common fish size is 30 inch and accounts for 18% of the total.
• Average size of the fish within the measured area is 34 inch.
Note: The number of the graph bars on the fish size histogram window can be
changed on the [Measurement] menu (see page 1-39).
1.12.3 How to move the fish size histogram window
How to move the window to the preset location
1. Press the MENU/ESC key and open the [Setting] tab.
2. Select [Measurement], then push the ENTER knob.
[Horizontal] [Vertical]
AVG:34 DATA:186
[inch]
39
23
14
8
6
30
25
AVG:34 DATA:186 [inch]
39231486
30
25
AVG:34 DATA:186
[inch]
39
23
14
8
6
30
25
Unit of fish size
Number of measurements
within the measured area.
Average fish size
Fish size (inch or cm) Distribution quantity (%)
Most common
fish size
Second most
common fish size
Second most
common fish size
 Loading...