1. OPERATION
1-33
• HF: Show the sonde mark on the high frequency display.
5. Select [Mark Color], then push the ENTER knob.
6. Set the color desired, then push the ENTER knob.
7. Select [Width of Mark], then push the ENTER knob.
8. Set the line width, then push the ENTER knob.
The greater the value the thicker the line width.
9. Press the MENU/ESC key several times to close the menu.
Note: To hide the sonde mark, select [Off] at step 4.
1.24.2 How to show the V-temperature graph
The V-temperature graph plots depth and water temperature data fed from the net
sonde. Do the following to show the V-temperature graph.
1. Press the MENU/ESC key, then open the [Setting] tab.
2. Select [Data], then push the ENTER knob.
3. Select [Sonde Graph], then push the ENTER knob.
4. Select [On], then push the ENTER knob.
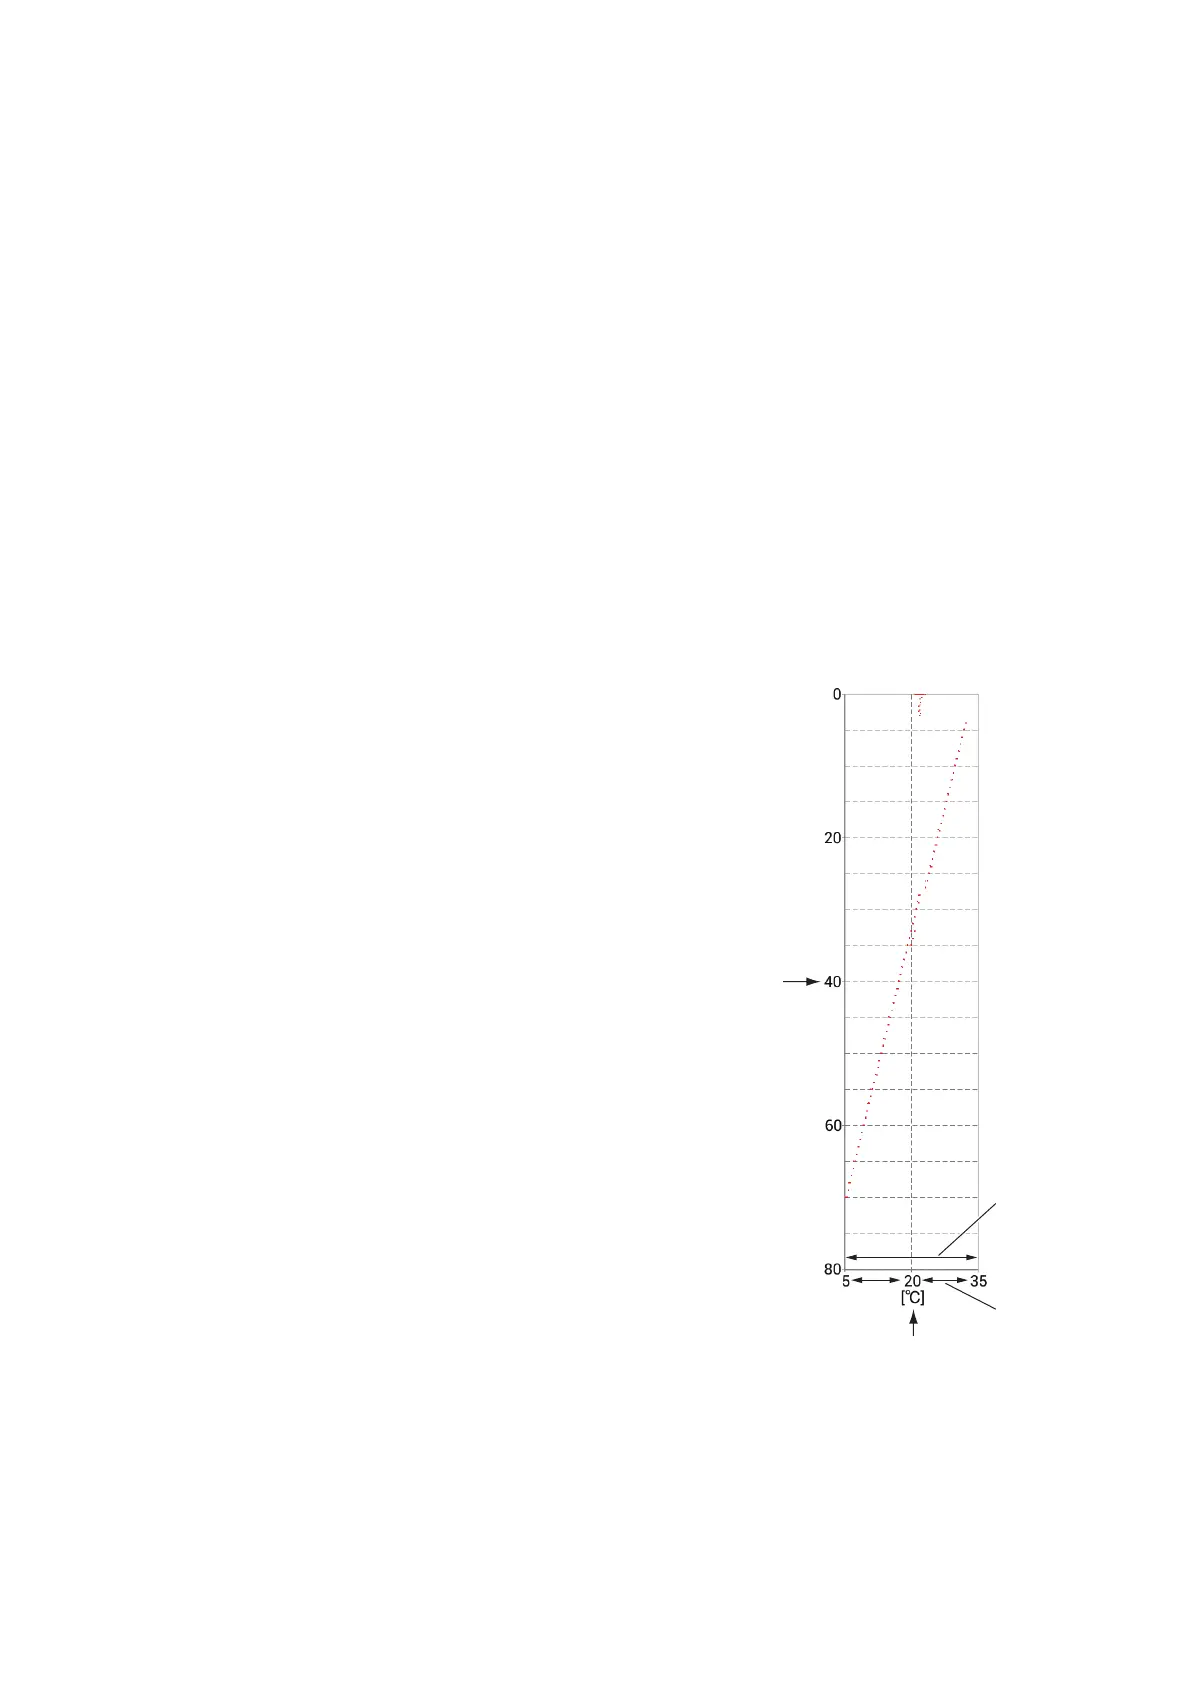
The V-temperature graph window ap-
pears at the left of the display. The
graph plots depth and water tempera-
ture data fed from the No.1 net sonde
transmitter in red. Water temperature
is plotted on the horizontal axis; depth
on the vertical axis. The graph scale
for the vertical axis changes accord-
ing to the display range. When the lat-
est water temperature data exceeds
the graph scale of the horizontal axis,
the scale changes automatically.
The depth and temperature units
used for the V-temperature graph are
fixed to meters and °C.
5. Press the MENU/ESC key several
times to close the menu.
Note 1: To close the V-temperature graph
window, select [Off] at step 4.
Note 2: You can refresh the V-tempera-
ture graph with [Graph Reset] on the Data
menu. After refreshing the graph, the
scale and plot data are deleted, then plot-
ting of the data is restarted.
Scale
(30ºC)
Horizontal axis
(Water temperature: ºC)
Grid line
(15ºC)
Vertical axis
(Depth: m)

 Loading...