Chapter 7. Logging Data
Transport® Model PT878 Portable Liquid Flowmeter User’s Manual 151
7.5.2 Displaying Log Data in Graphical Form (cont.)
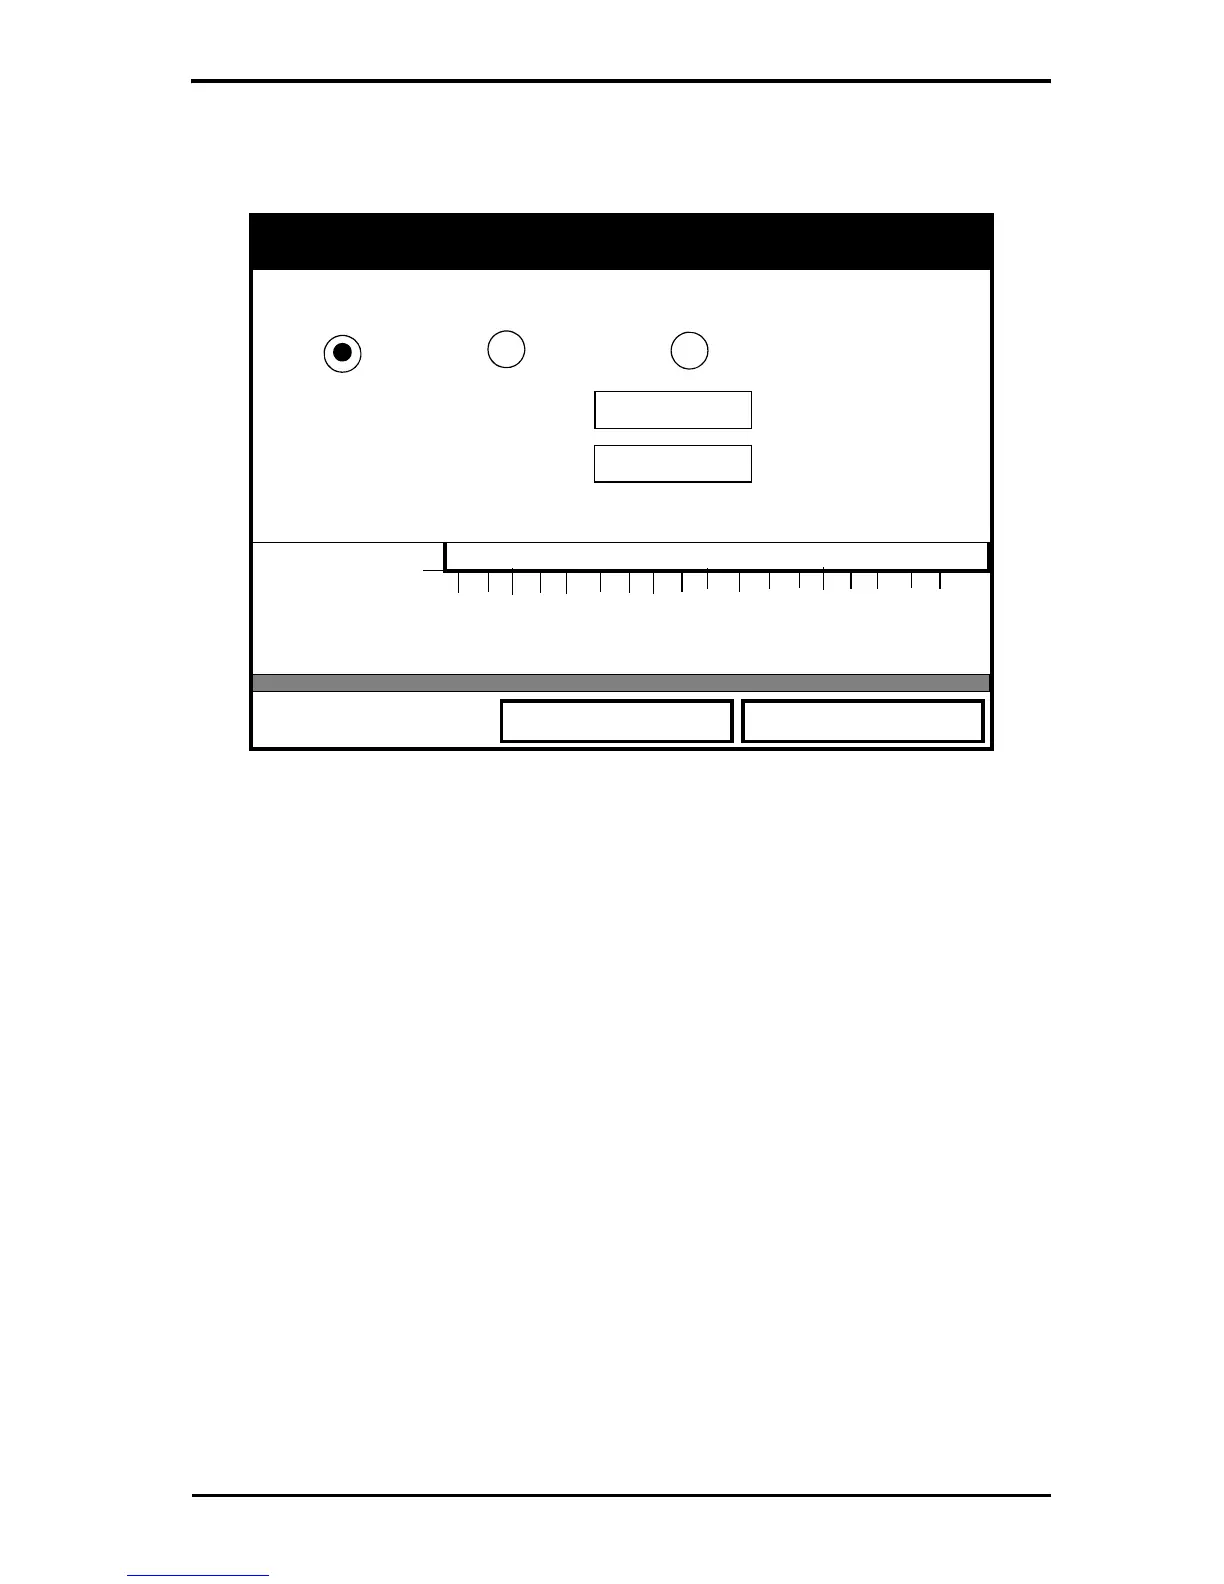
Figure 101: Y-Axis Window
The Y-Axis window (shown in Figure 101 above) allows you to specify
whether the Y axis on the graph extends to the maximum value (Max), over
the entire range (Range) or between certain specified values (Set).
1. Use the [W] and [X] keys to scroll to the desired limit type. Press
[ENTER] to confirm the entry.
If you select Max or Range for limits, you have finished entering data in this
form. If you select Set, the PT878 asks for minimum and maximum limits.
2. Press the [T] key to reach the Minimum text box.
a. Press [ENTER] to open the text box.
b. Use the numeric keys to enter the desired value.
c. Press [ENTER] to confirm the entry.
3. Repeat step 2 to enter the Maximum value.
4. When you have finished, press [F2] (Cancel) to cancel the entries, or [F3]
(OK) to confirm the entries and change the graph.
AAA.LOG (Dew Point, °C)
-52.0
2003/03/01
2003/03/01
13:23:41 PM
13:53:41 PM
Y-Axis
Limits
Max
Range
Set
Minimum
Maximum
Cancel
OK
-52
-52

 Loading...