ENGINEERING MANUAL OF AUTOMATIC CONTROL
CHILLER, BOILER, AND DISTRIBUTION SYSTEM CONTROL APPLICATIONS
347
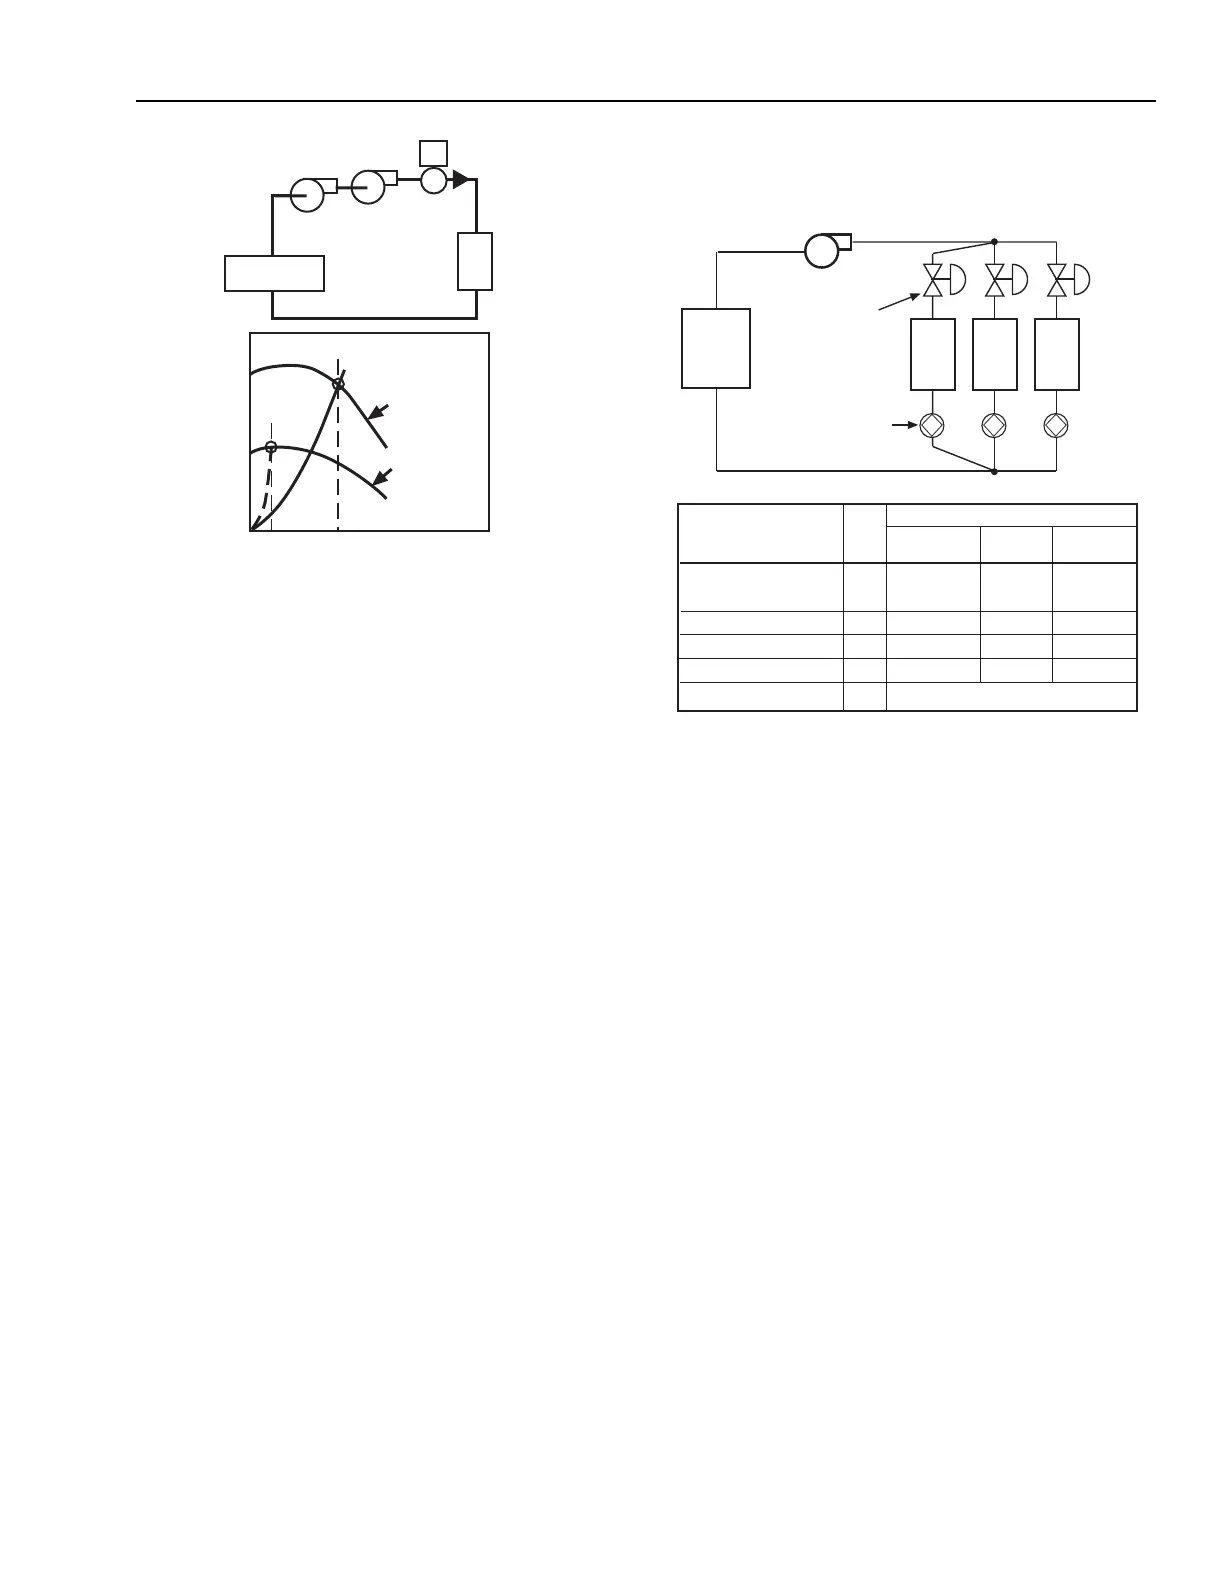
Fig. 67. System Operation for Series Pumps.
Dual Pump Curves
For pumps in parallel (Fig. 66), assuming two identical
pumps, the curve is developed using the following formula:
gpm
3
=(gpm
1
) x 2 for any h
1
Where:
gpm
3
=Total flow for both pumps
gpm
1
= gpm of one pump
h
1
= Head in ft for Pump 1 at gpm
1
for any point
on pump curve
For pumps in series (Fig. 67), assuming two identical pumps,
the curve is developed using the following formula:
h
3
=(h
1
) x 2 for any gpm
1
Where:
h
3
=Total head in ft for both pumps
h
1
= Head in ft for one pump at gpm
1
(for any
point on Pump 1 curve)
DISTRIBUTION SYSTEM FUNDAMENTALS
Figure 68 illustrates a closed system where static head
(pressure within the system with pump off) does not need to be
considered as long as all components are rated for the static
head encountered. The pump provides force to overcome the
pressure drop through the system and valves control the flow
and pressure through the system. Figure 69 shows a graph of
the system and pump curves for design load and reduced load
conditions. The system curve indicates the pressure drop
through the system (with the control valves full open) at various
flow rates. The pump curve shows the pump output pressure at
various flow rates. Flow always follows the pump curve.
SERIES
PUMPS
CONTROL
VALVE(S)
LOAD
2 PUMPS
1 PUMP
24%
LOAD
FULL
LOAD
FLOW
HEAT
EXCHANGER
HEAD
C2410
Fig. 68. Simplified Water Distribution System.
In Figure 68 the flow and pressure considerations are:
1. The flow through the heating or cooling source, the supply
piping, and the return piping (40 gpm) is the same as the
sum of the flows through the three coil circuits:
10 + 12 + 18 = 40 gpm.
2. Design pressure drop (head loss) includes the drop
through the heating or cooling source, supply piping,
return piping, and the highest of the three coil circuits:
23 + (10 + 11) = 44 ft.
NOTE: In this example, Coil 1 and 3 balancing valves
balance each load loop at the 21 ft design for
Loop 2. If the actual coil and control valve
drops were less than the design maximum
values, the actual balancing valve effects
would be greater.
In this example the pump must handle 40 gpm against a total
head of 44 ft (19 psi) as shown in Figure 69. (This curve is
taken from actual pump tests). The design drop across the valve
is 11 ft (4.5 psi) with the valve fully open.
If Figure 68 is a heating system, as the loads reduce valves
V1, V2, and V3 start to close. Hot water flow must be reduced
to about 15 percent of full flow (6 gpm) to reduce heat output
to 50 percent. As flow through the coil is reduced the water
takes longer to pass through the coil and, therefore, gives up
more heat to the air.
HEATING/
COOLING
SOURCE
1
V1
2
V2
3
V3
HEATING
OR
COOLING
COILS
PUMP
SUPPLY PIPING
RETURN PIPING
CONTROL
VALVES
BALANCING
VALVES
M15054
* SUM OF SOURCE AND PIPING (23 FT) AND LOOP 2 (21 FT) = 44
DESIGN PRESSURE DROP IN FEET
FLOW
GPM
COIL & PIPING
CONTROL
VALVE
BALANCING
VALVE
ITEM
40
23* _ _
HEATING OR COOLING
SOURCE AND
DISTRIBUTION PIPING
COIL 1 LOOP
COIL 2 LOOP
COIL 3 LOOP
TOTAL FLOW AND DROP
10 8 11 2
12 10* 11* 0
18 7 11 3
40 44*
 Loading...