194
7 Operating Control and Displays
The curve screen shows the setpoint curves for the channels (ratio controller) per curve set.
The user can switch between showing a curve-based format (setpoint graphic) and a display
in tabular format (curve table).
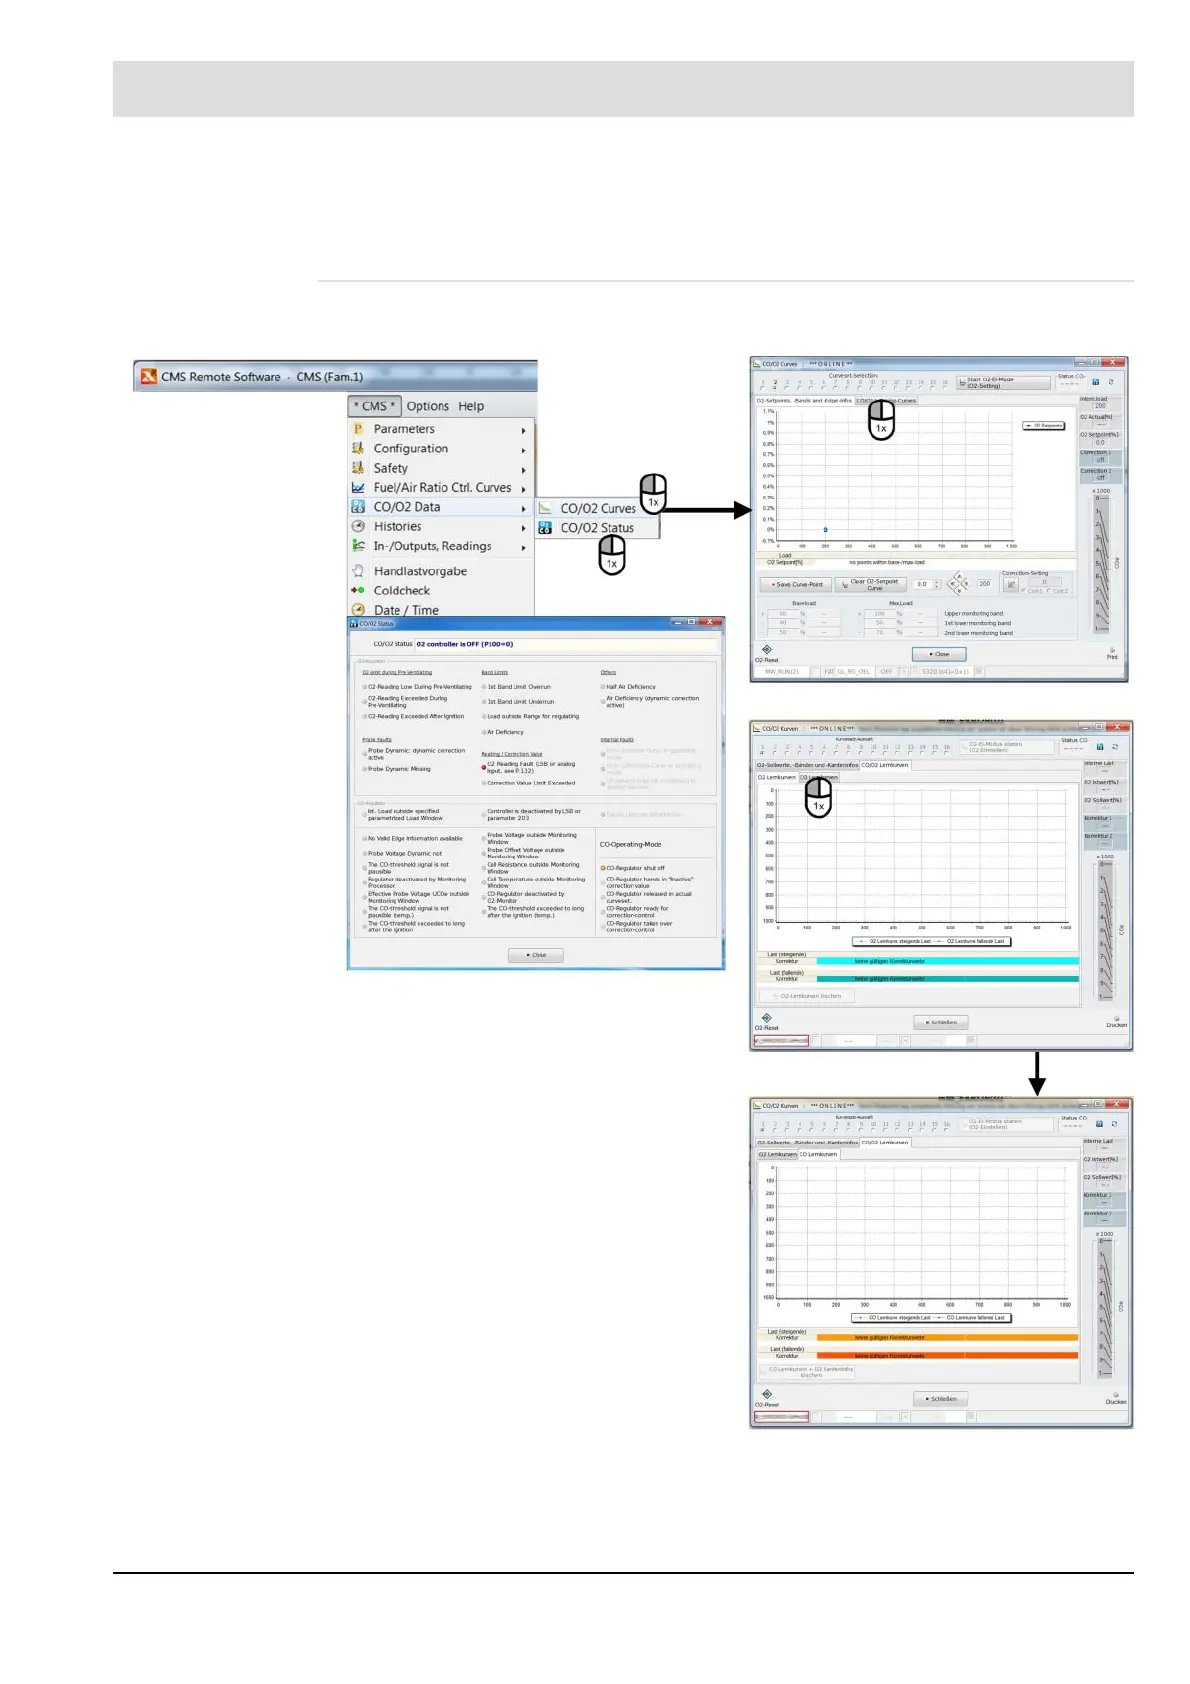
CO/O2 Data
Accessing CO/O
2
data (AL1)
Fig. 7-74 CO/O
2
data menu with submenus
The curves are programmed in this menu in the same way as in the RC curves menu – see
chapter 6.3.1 Programming Curves

 Loading...