Analyze Waveform Data
Using FFT
An FFT breaks down s ignals into component frequencies, which the oscilloscope uses to display a graph of the frequency domain
of a signal, as opposed to the oscilloscope’s standard time domain graph. You can match these frequencies with known system
frequencies, such as system clocks, oscillators, or power supplies.
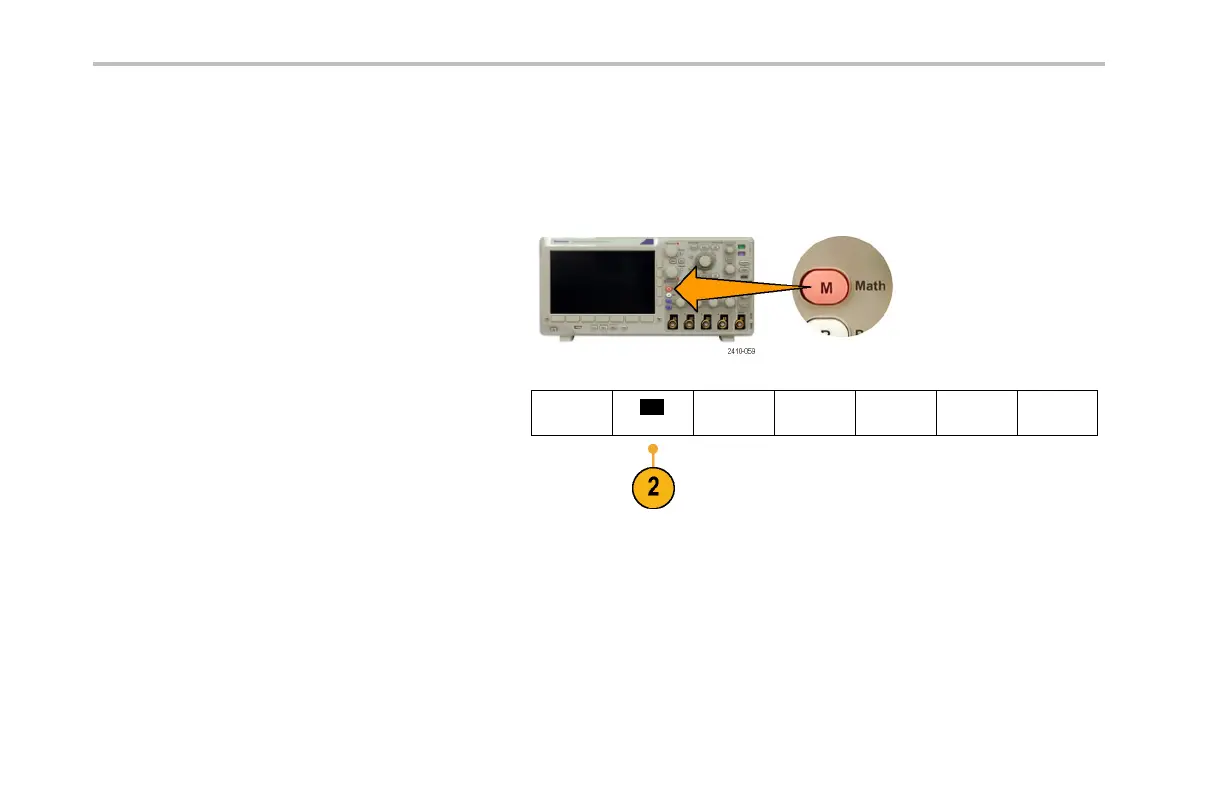
1. Push Math.
2. Push FFT.
Dual Wfm
Math
FFT
Advanced
Math
(M) Label
180 DPO3000 Series Oscilloscopes User Ma nual
 Loading...