Graphs
28 RT-SVX49C-EN
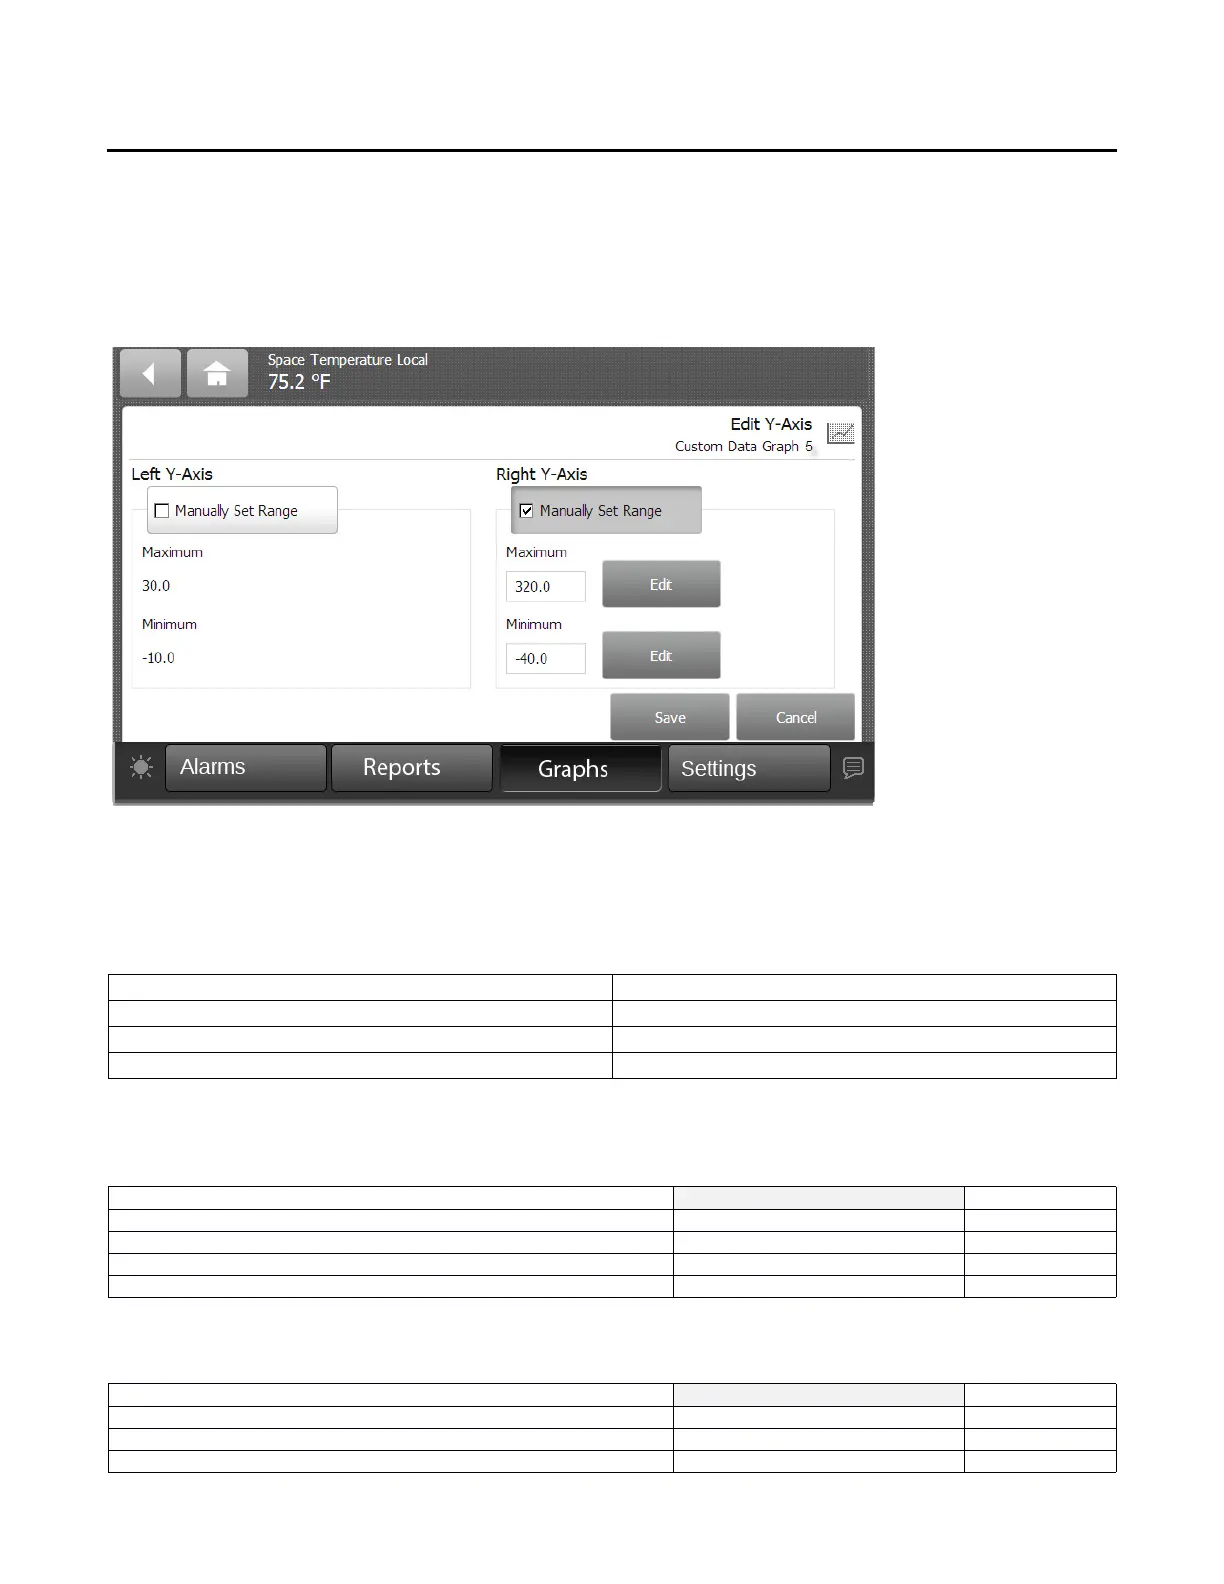
The Edit Y-Axis screen appears (Figure 19, p. 28).
11. Touch the Manually
Select Range box for either the left
or right Y-axis.
12. Touch the edit bu
tton n
ext to one of the two value
ranges.
The Keypad screen appears.
13. Select a new value and then touch Enter to save.
14.
Repeat steps 2 through 4 until all preferred changes
have been
made.
Figure 19. Editing theY-Axis
Standard Graphs
There shall be 8 standard graphs.The standard graphs are
below:
Table 10. Standard graphs
Space Temperature Economizer
Compressor Outside Air Ventilation
VAV Humidity
Heat Pump CO
2
Space Temperature:
The table below describes the data in the System Status
graph:
Data Point Line Color Axis
Active Space Temp Setpoint Blue Left
Active Space Temp Green Left
Supply Air Temp Black Left
Return Air Temperature Red Left
Compressor Graph:
The table below describes the data in the graph:
Data Point Line Color Axis
Active Supply Air Temp Setpoint Pink Left
Variable Compressor Speed % Green Left
Supply Air Temp Black Left
 Loading...