UTD1000 User Manual
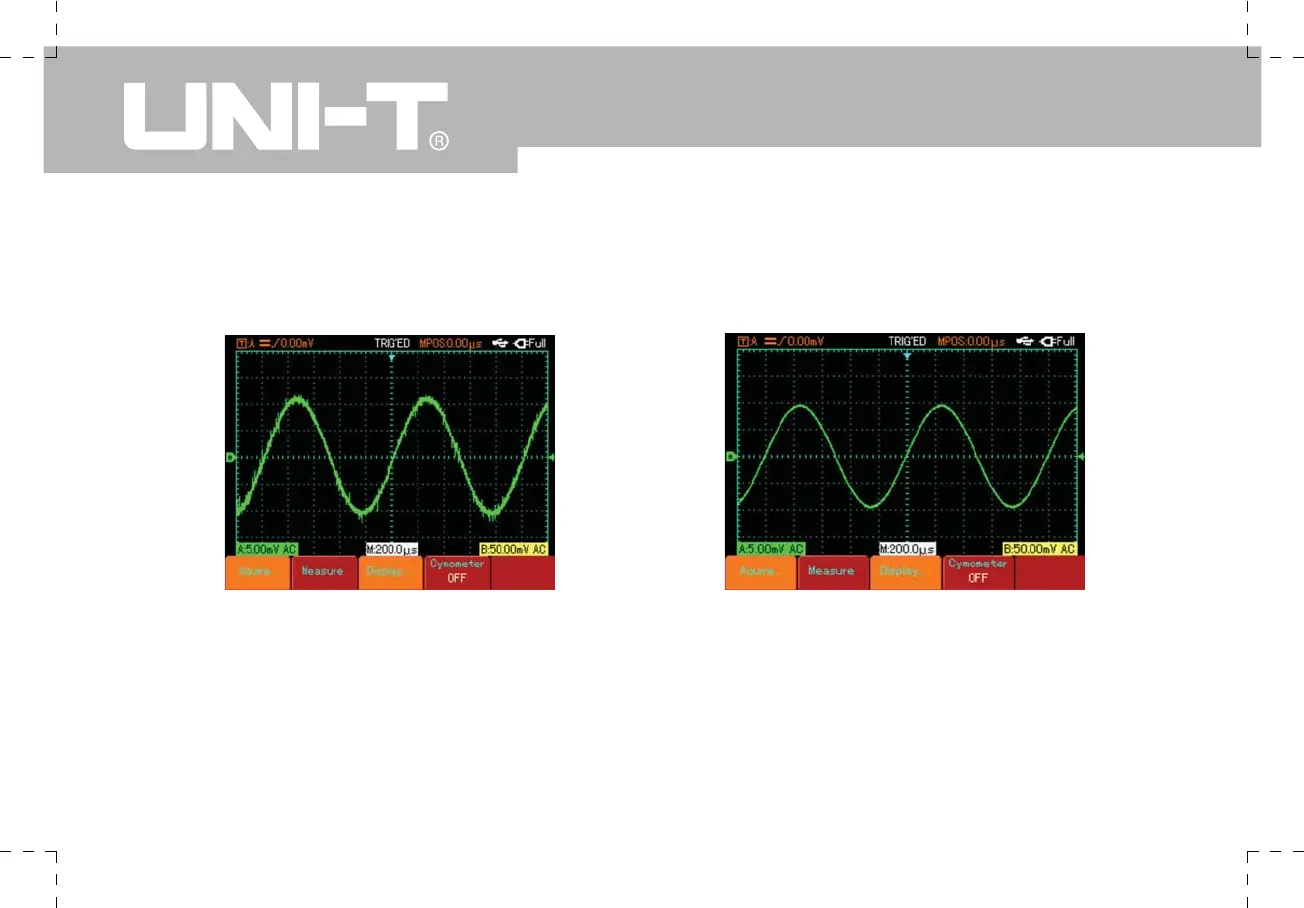
By changing sampling setup, you can observe the consequent changes in waveform display. For example, if the signal
contains considerable noise, you will see the following displays when average sampling is not selected and when 32-
time average sampling is selected. For sampling waveform display please see Figure 2-20 and Figure 2-21.
Figure 2-20 Waveform without average sampling Figure 2-21 Waveform display when 32-time
average sampling is selected
Note :
1. Use Real time sampling to observe single signals.
2. Use Equivalent sampling to observe high frequency cyclical signals.
3. To avoid mixed envelop, select Peak Detect.
4. To reduce random noise of the displayed signal, select average sampling and increase the average number of
times in multiples of 2, i.e selecting from 2 to 256.
 Loading...