19990401
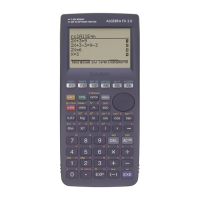
k Med-box or Box and Whisker Graph (Box)
This type of graph lets you see how a large number of data items are grouped within specific
ranges. A box encloses all the data in an area from the first quartile (Q1) to the third quartile
(Q3), with a line drawn at the median (Med). Lines (called whiskers) extend from either end
of the box up to the minimum (minX) and maximum (maxX) of the data.
XList specifies the list where the data is input, while Freq specifies the list where the data
frequency is input. 1 is specified for Freq when frequency is not specified.
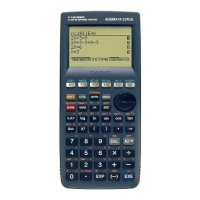
k Modified Box Graph (ModB)
The modified box graph omits everything in the range past 1.5 × IQR (IQR = Q3 – Q1,
Q3: 3rd quartile, Q1: 1st quartile) from the med-box 4th quartile and draws whiskers.
Outliers are displayed as plot points.
XList specifies the list where the data is input, while Freq specifies the list where the data
frequency is input. 1 is specified for Freq when frequency is not specified.
6-2-2
Calculating and Graphing Single-Variable Statistical Data
#Input a positive integer for frequency data.
Other types of values (decimals, etc.) cause
an error.
minX Q1 Med Q3 maxX
#Dimension ERROR usually occurs when two
lists contain a different number of elements.
20011101
 Loading...