EasyManuals Logo
Home>Casio>Calculator>ALGEBRA FX 2.0 Plus

Casio ALGEBRA FX 2.0 Plus User Manual

Casio ALGEBRA FX 2.0 Plus
455 pages
To Next Page IconTo Next Page
To Previous Page IconTo Previous Page
Page #272 background imageLoading...
Page #272 background image
19990401
k Overlaying a Function Graph on a Statistical Graph
Description
You can overlay a paired-variable statistical graph with any type of function graph you want.
Set Up
1. From the Main Menu, enter the STAT Mode.
Execution
2. Input the data into a list, and draw the statistical graph.
3. Display the Graph Function menu, and input the function you want to overlay on the
statistical graph.
4. Graph the function.
6-3-13
Calculating and Graphing Paired-Variable Statistical Data

Table of Contents

Other manuals for Casio ALGEBRA FX 2.0 Plus

Questions and Answers:

Question and Answer IconNeed help?

Do you have a question about the Casio ALGEBRA FX 2.0 Plus and is the answer not in the manual?
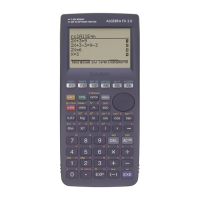
Casio ALGEBRA FX 2.0 Plus Specifications

General IconGeneral
TypeScientific
CoverNo
Form factorPocket
Control typeButtons
Product colorBlack
Digits12 digits
Display typeDot-matrix
Backlight colorGreen
Backlight displayYes
Display resolution128 x 64 pixels
Display number of lines8 lines
Display number of characters21
RAM capacity0.75 MB
ROM capacity0.1406 MB
Storage media type-
Battery typeCR2032, AAA
Power sourceBattery
Number of batteries supported5
Weight and Dimensions IconWeight and Dimensions
Depth178 mm
Width82 mm
Height19.5 mm
Weight213 g

Related product manuals