Status
E220 Series Cellular Router User Guide 38
Realtime Graphs
Status > Realtime Graphs
Use Real-Time Graph to view Router related activities for different time intervals.
The period wise graph will display the following graphs for the selected period: Load Average, Interface
Traffic information (LAN, WAN, Tunnel, Wi-Fi), Wireless usage Information and Connection detailed
information.
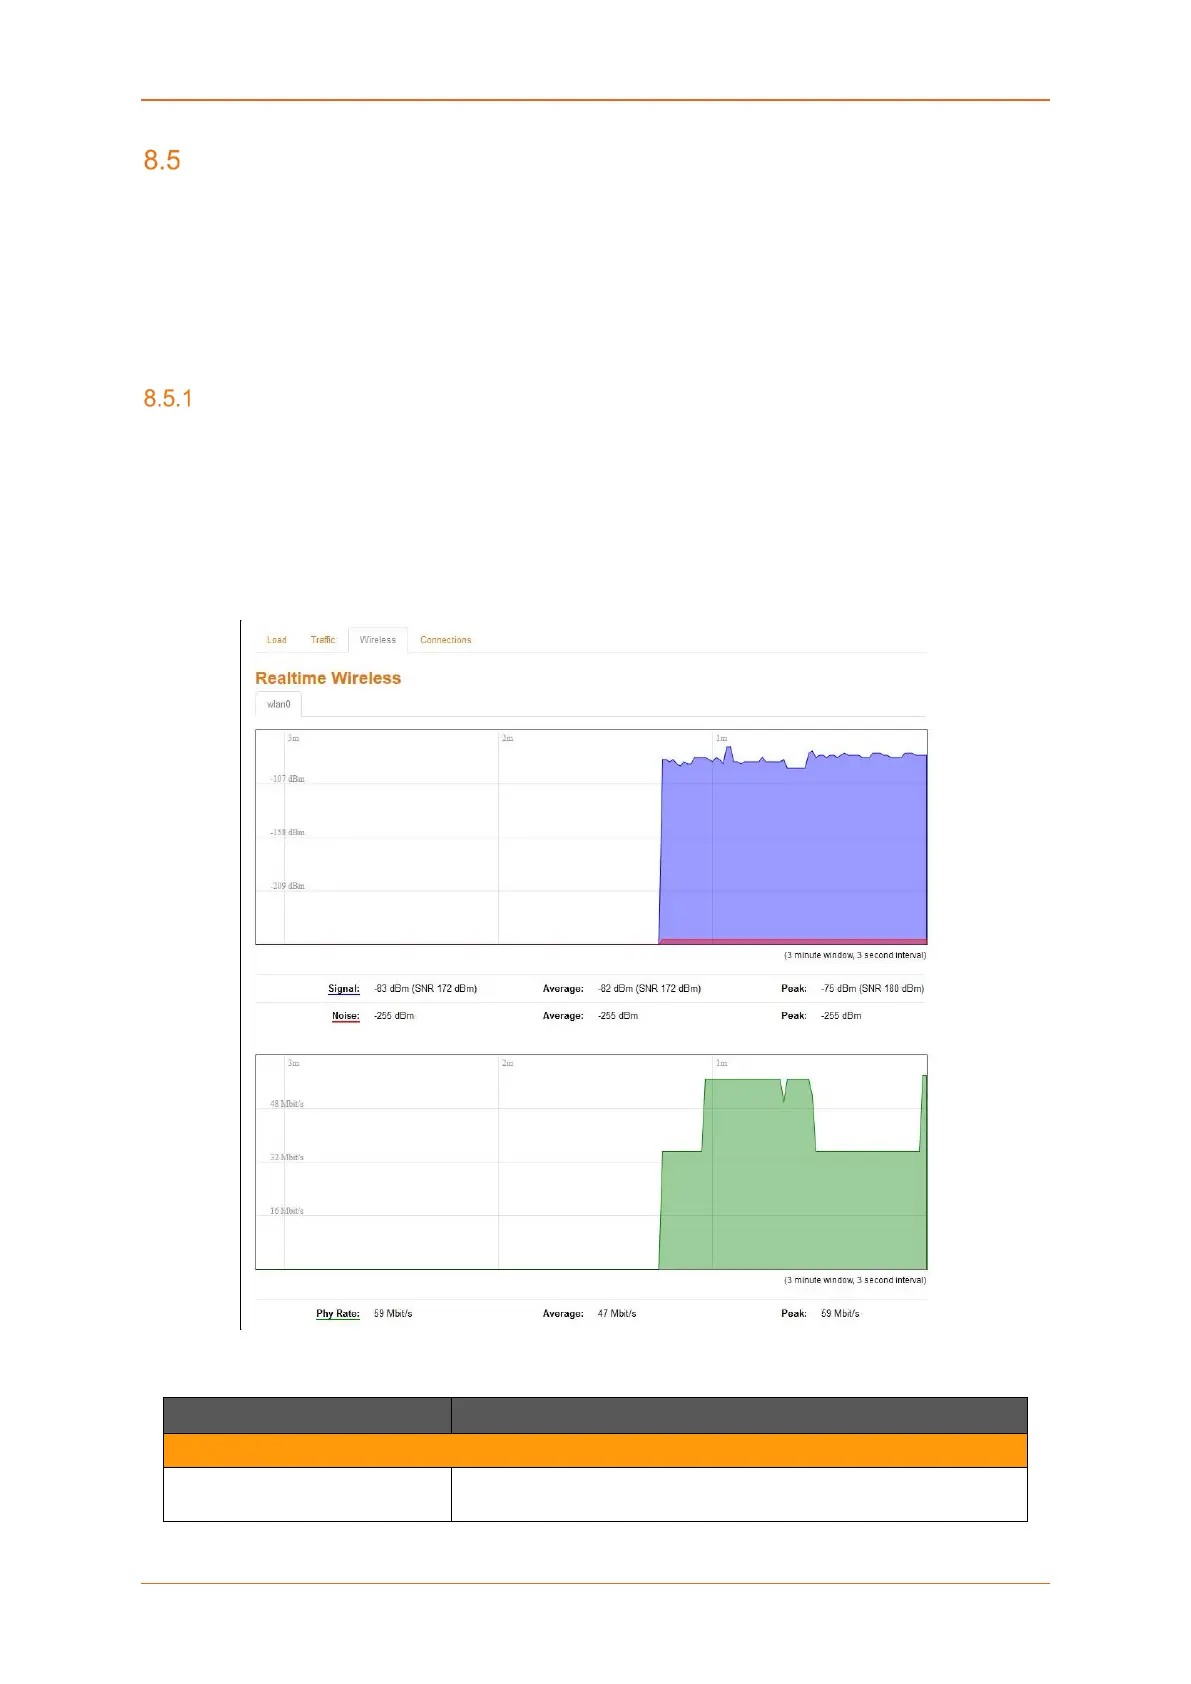
Wireless
Status > Realtime Graphs > Wireless
Wireless indicates the traffic on Wi-Fi irrespective of Wi-Fi being used as an access point (LAN) or
Client (WAN).
Wireless Graphs displays real time graph combined for Signal and Noise data transferred in real time.
Colors differentiate Signal and Noise data rates. It also displays the Physical data transfer rate. In
addition, shows the average and peak Signal and Noise and Physical data rates individually.
Screen 8-3: Real Time Wireless Traffic Graph
Parameters Description
WLAN Interface
Signal Graph shows the periodic average of Signal and Noise on the
Router.
 Loading...