15.8Measuringdistancesand
bearings
Youcanusethedatabarandcontextmenuinformationyoucan
usethemeasurefunctiontomeasuredistancesinthechart
application.
Youcandeterminethedistanceandbearing:
•fromyourvesseltothepositionofthecursor;
•betweentwopointsonthechart.
Measuringfromvesselpositiontocursor
Fromthechartapplication:
1.Selectthelocationonscreenthatyouwanttomeasurethe
distanceorbearingfromyourvessel.
Thechartcontextmenuwillbedisplayed.
2.SelectMeasure.
Thefollowingwillhappen:
•Themeasuremenuwillbedisplayed.
•Alinewillbedrawnfromthecursorpositiontothecenter
ofthescreen.
•Thecursorlocationwillbemovedatthecenterofthe
screen.
•Thebearinganddistancewillbedisplayednexttothenew
cursorlocation.
3.FromthemeasuremenuselectFromsothatShipisselected.
Therulerlineisre-drawnfromthecursorpositiontoyour
vessel.
4.Youcannowadjusttherulerpositionbymovingthecursor
tothedesiredlocation.
5.Ifyouwanttherulerdisplayedafteryouhaveclosedthe
measuremenu,selectRuler:sothatOnishighlighted.
SelectingrulerwillswitchtherulerOnandOff.
6.SelectBackorOktoclosethemeasuremenuleavingthe
currentmeasurementon-screen.
Measuringfrompointtopoint
Fromthechartapplication:
1.Selectthelocationonscreenthatyouwanttomeasurethe
distanceorbearingfromyourvessel.
Thechartcontextmenuwillbedisplayed.
2.SelectMeasure.
Thefollowingwillhappen:
•Themeasuremenuwillbedisplayed.
•Alinewillbedrawnfromthecursorpositiontothecenter
ofthescreen.
•Thecursorlocationwillbemovedatthecenterofthe
screen.
•Thebearinganddistancewillbedisplayednexttothenew
cursorlocation.
3.SelectFromsothatCursorisselected.
SelectingmeasurefromwillswitchbetweenShipandCursor.
4.Youcannowadjusttheendpointbymovingthecursortothe
desiredlocation.
5.YoucanalsoSwapDirectionoftherulersothatthebearing
becomesthebearingfromendpointtostartpoint.
6.Ifyouwanttherulerdisplayedafteryouhaveclosedthe
measuremenu,selectRulersothatOnishighlighted.
SelectingdisplayrulerwillswitchtherulerOnandOff.
7.SelectBackorOktoexitthemeasuremenuleavingthe
currentmeasurementon-screen.
Repositioningtheruler
Youcanrepositionarulerbyfollowingthestepsbelow.
1.Selectthecurrentruler.
Therulercontextmenuisdisplayed.
2.SelectMeasure.
Youcannowrepositiontherulerasrequired.
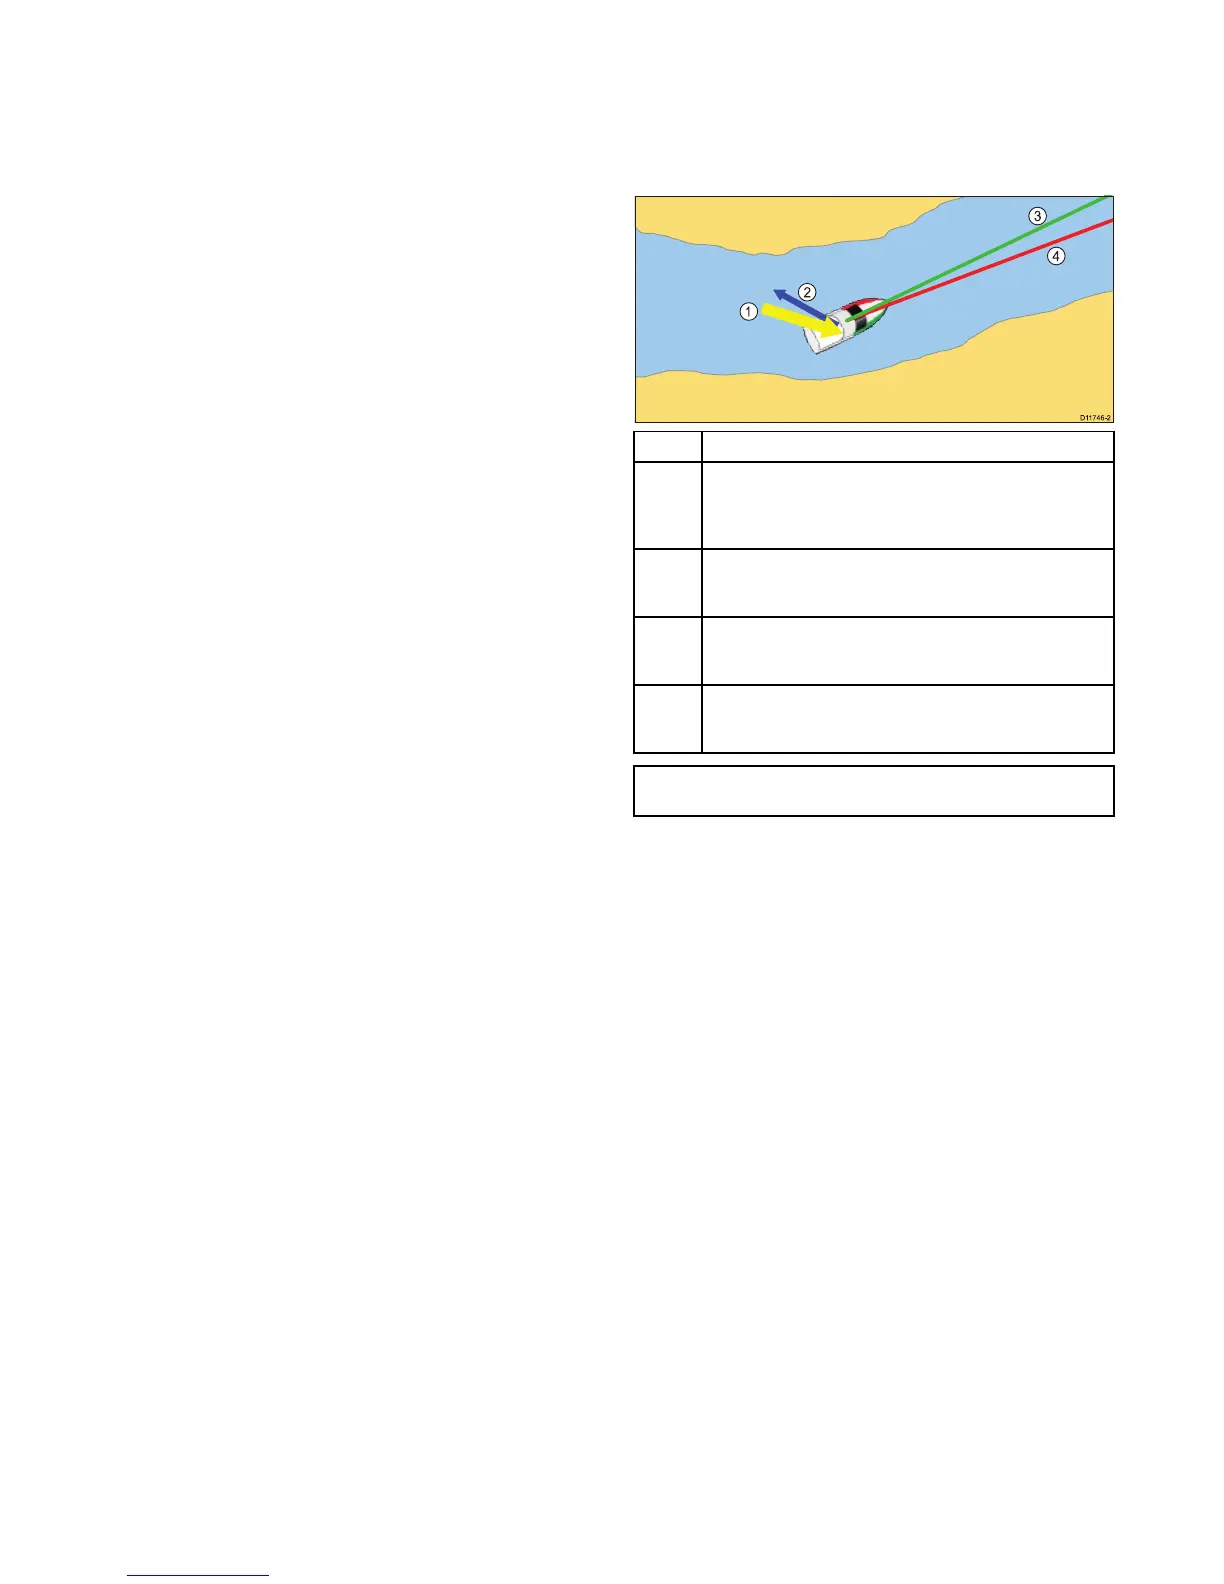
15.9Chartvectors
Chartvectorsdisplayindicatorsforheading,COG,winddirection
andtidedirection.
Arangeofvectorgraphicscanbedisplayedinthechart
applicationwhenin2Dchartview.Thefollowingvectorscanbe
independentlyenabledordisabled:
ItemDescriptions
1Windarrow—winddirectionisdisplayedasayellowline
withsolidarrowheadspointingtowardsyourvessel,indicating
thewinddirection.Thewidthofthearrowindicatesthewind
strength.
2Tidearrow—tideisdisplayedasabluelinewithsolidarrow
headpointingawayfromyourvessel,inthedirectionofthetidal
set.Thewidthofthearrowindicatesthetidestrength.
3
COG(CourseOverGround)vector—agreenlineindicates
thevessel’sactualcourse.Adoublearrowheadisusedifthe
vectorlengthissettoavalueotherthaninnite.
4
HDG(heading)vector—aredlineshowsthevessel'sheading.
Anarrowheadisusedifthevectorlengthissettoavalueother
thaninnite.
Note:IfSpeedOverGround(SOG)orheadingdataisnot
available,vectorscannotbedisplayed.
Vectorlength
ThelengthoftheHDGandCOGvectorlinesisdeterminedby
thedistanceyourvesselwilltravelinthetimeyouspecifyat
yourcurrentspeed.
Enablinganddisablingchartvectors
In2Dchartview:
1.SelectMenu.
2.SelectPresentation.
3.SelectLayers.
4.SelectVectors.
5.SelecttherelevantmenuitemtoswitchHeadingVector,
COGVector,TideArrow,orWindArrowOnorOffas
appropriate.
Settingvectorlengthandwidth
Youcanspecifythelengthandwidthoftheheadingandcog
vectors
In2Dchartview:
1.SelectMenu.
2.SelectPresentation.
3.SelectLayers.
4.SelectVectors.
5.SelectVectorLength.
Alistoftimesisdisplayed.
6.SelectatimesettingorselectInnite.
7.SelectVectorWidth.
Alistofwidthsisdisplayed.
8.SelecteitherThin,NormalorWide.
Chartapplication
147
 Loading...