Getting Acquain
tedwithYourInstrument
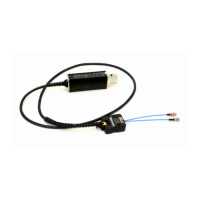
Histogram display. The instrument displays successive measurements as a histogram. The number of bins along
the horizontal
axis are set in the Settings > Stat menu.
1. The upper and lower Limits A larm levels (if active). When limit testing is active, the instrument autoscales the graph to
show both the histogram and the limit. The instrument only uses data inside the limits for autoscaling; measurements
outside the visible graph area are shown by an arrowhead at the left or the right edge of the display.
2. The running mean measurement value (X
).
3. The percent of the measurement completed.
4. The graph center (marked with a dark triangle) and corresponding frequency.
5. The graph horizontal scale per division. Limits Alarm (if active) sets the scale to s how both the current measurements
and the limit settings. The instrument continually autoscales the histogram bins based on the measured data.
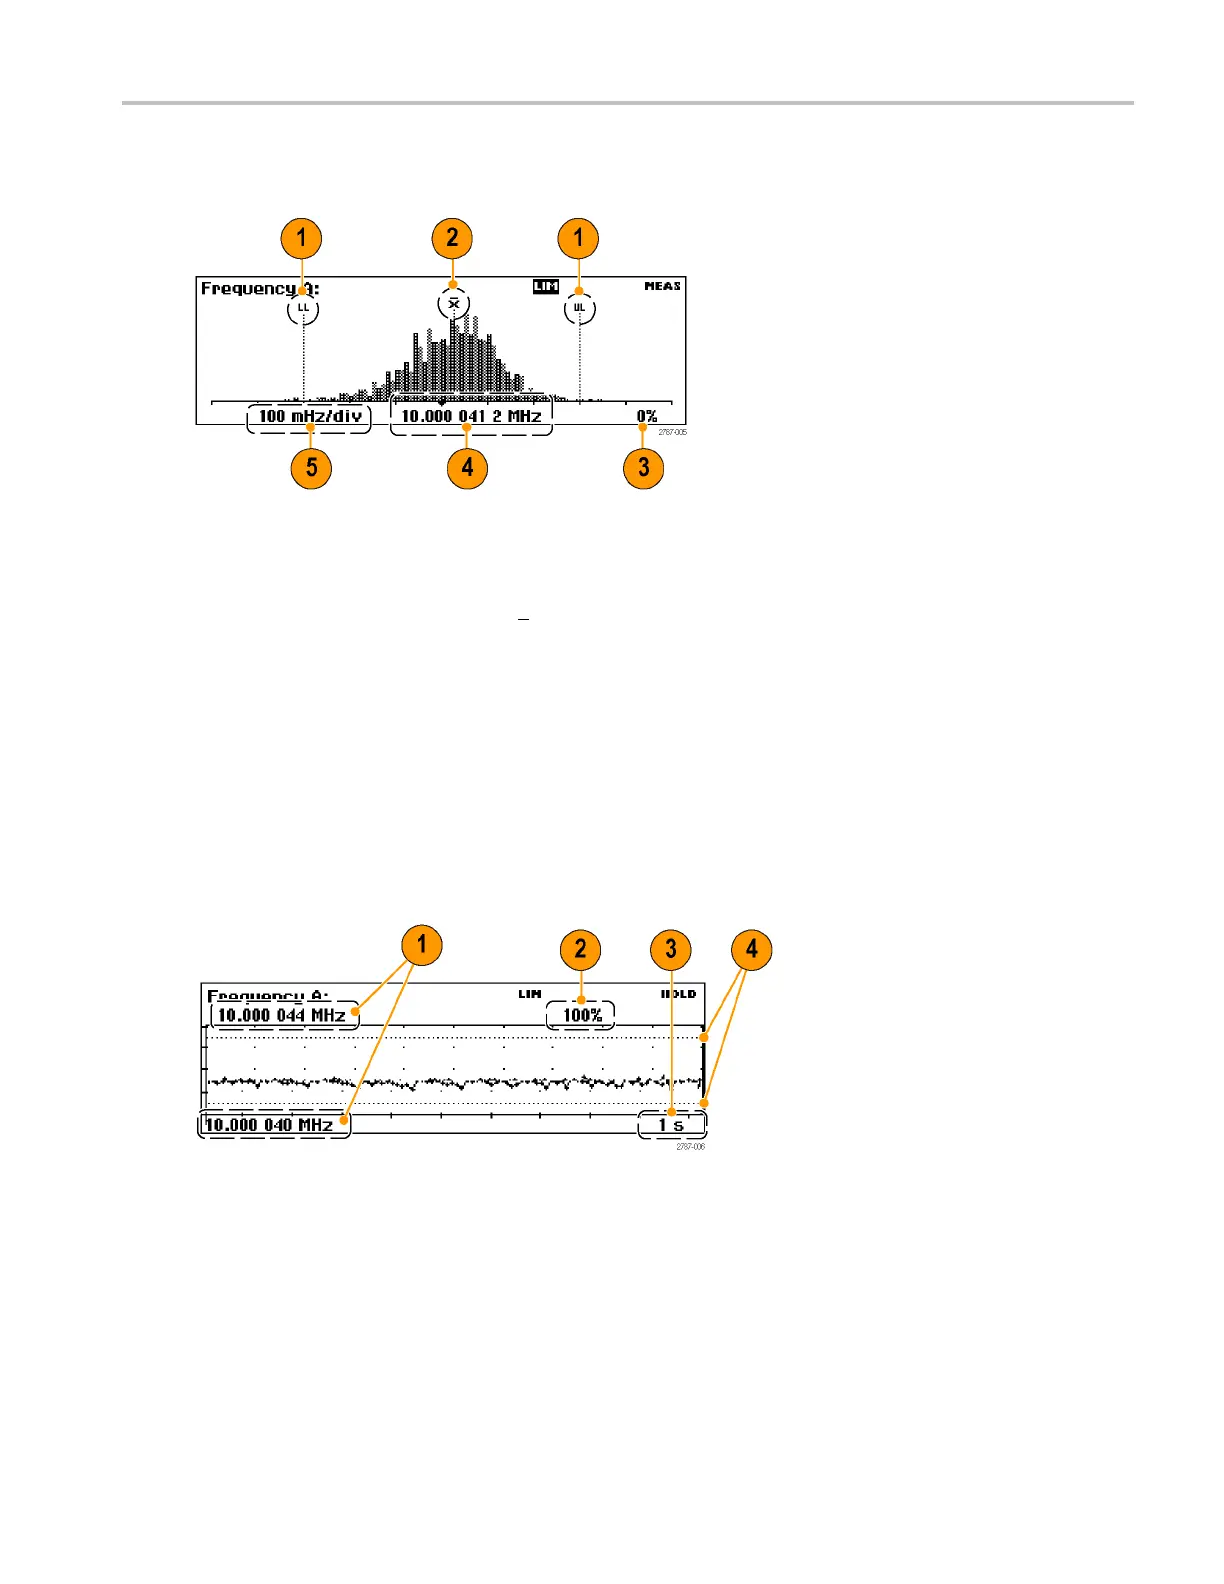
Trend plot display. The instrument takes successive measurements and plots the values over time. This mode is useful
for observing fluctuations or measurement deviation trends. A trend plot stops (if Hold is activated) or restarts (if Run is
activated) after the set number of samples is completed. The trend plot graph continually autoscales based on the measured
data, starting with zero at restart. Limit Alarms, if active, are shown as horizontal lines.
1. The upper and lower frequency range of the plot display. The trend plot graph continually autoscales based on the
measured data to show the measurement trend values.
2. The percent of the measurement completed.
3. The horizontal units per division.
4. T he Limits A lar m levels (if active). When lim i t testing is active, the instrument sets the graph scale to show both the
measurement trend plot and the limit values (horizontal dashed lines).
FCA3000, FCA3100, and MCA3000 Series Quick Start U ser Manual 11

 Loading...