Getting Acquain
ted with Your Instrument
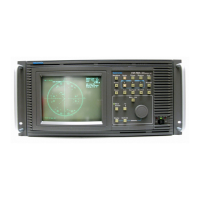
Controls
Power Button
Item Description
The Power button is a toggling secondary power switch. Part of the instrument is always on as soon as
line power is applied, indicated by the red LED above the button. Push the Power button to power on or
off the instrument.
Measurement Buttons
Use the Measurement buttons to select and display a measurement.
Item Description
Use the Meas button to display the instrument measurement menu along the bottom of the screen. Push a
menu button directly below a menu item to select that menu item and open a sub-menu as needed.
Typical m easurements include frequency, period, time, pulse, phase, totalize (FCA3100 Series only), and
volts. The available menu items depend on the instrument model and configuration.
Use the Value button to display the current measurement as a numerical value. The instrument also displays
supplementary measurements along the lower part of the screen.
Use the Analyze button to display the current measurement in one of three statistical analysis display modes.
Repeate
dly push the Analyze button to cycle through the statistical display modes:
Numeri
cal display: The instrument displays statistical data as numerical data. The statistical data
readouts include Mean (running mean value of the main measurement over N s amples), Max (maximum
value), Min (minimum value), P-P (peak-to-peak deviation), A dev (Allan deviation), and Std (standard
deviat
ion). (See page 10, Numerical display.)
Histogram display: The instrument displays successive main m easurement results as a histogram. The
bins i
n the histogram are autoscaled based on the measured data. Limits, if active, and the running mean
value X are shown as vertical dotted lines. The center of the graph is indicated by a filled triangl e on
the X-axis. The plot scale factor, plot center measurement value, and measurement percent complete
value
s are shown a long the bottom of the plot. Limit se ttings affect the autoscaling to show the current
measurements and the set limits simultaneously. (See page 11, Histogram display .)
Use the Settings > Stat > N o. Of Samples menu to set the number of bins along the horizontal axis.
Trend Plot display: The instrument displays successive m ain measurement results as a trend plot. This
mode is useful for observing periodic fluctuations or possible trends. The trend plot autoscales based
on t
he measured data, starting with 0 at restart. Lim its (if active) are shown as horizontal lines. (See
page 11, Trend plot display.)
Use the Auto Set button to automatically set trigger levels for the measurement function and input signal
amplitude (for relatively normal signals). This enables you to quickly set the instrument to display a
me
asurement.
Push the Auto Set button twice within two seconds to reset most instrument settings (such as measuring
time, mathematics, filter and arming) to their default values. The intention is to prevent possible lockups and
mi
sinterpretations when changing measurement function or test setup.
6 FCA3000, FCA3100, and MCA3000 Series Quick Start User Manual

 Loading...