Section 1: Scientific Method Name
Date
Fundamental Topics in Science © 2001 Texas Instruments
Try-It!™ 1-1
1: Scientific Method Try-It!™ on Your TI83 Plus
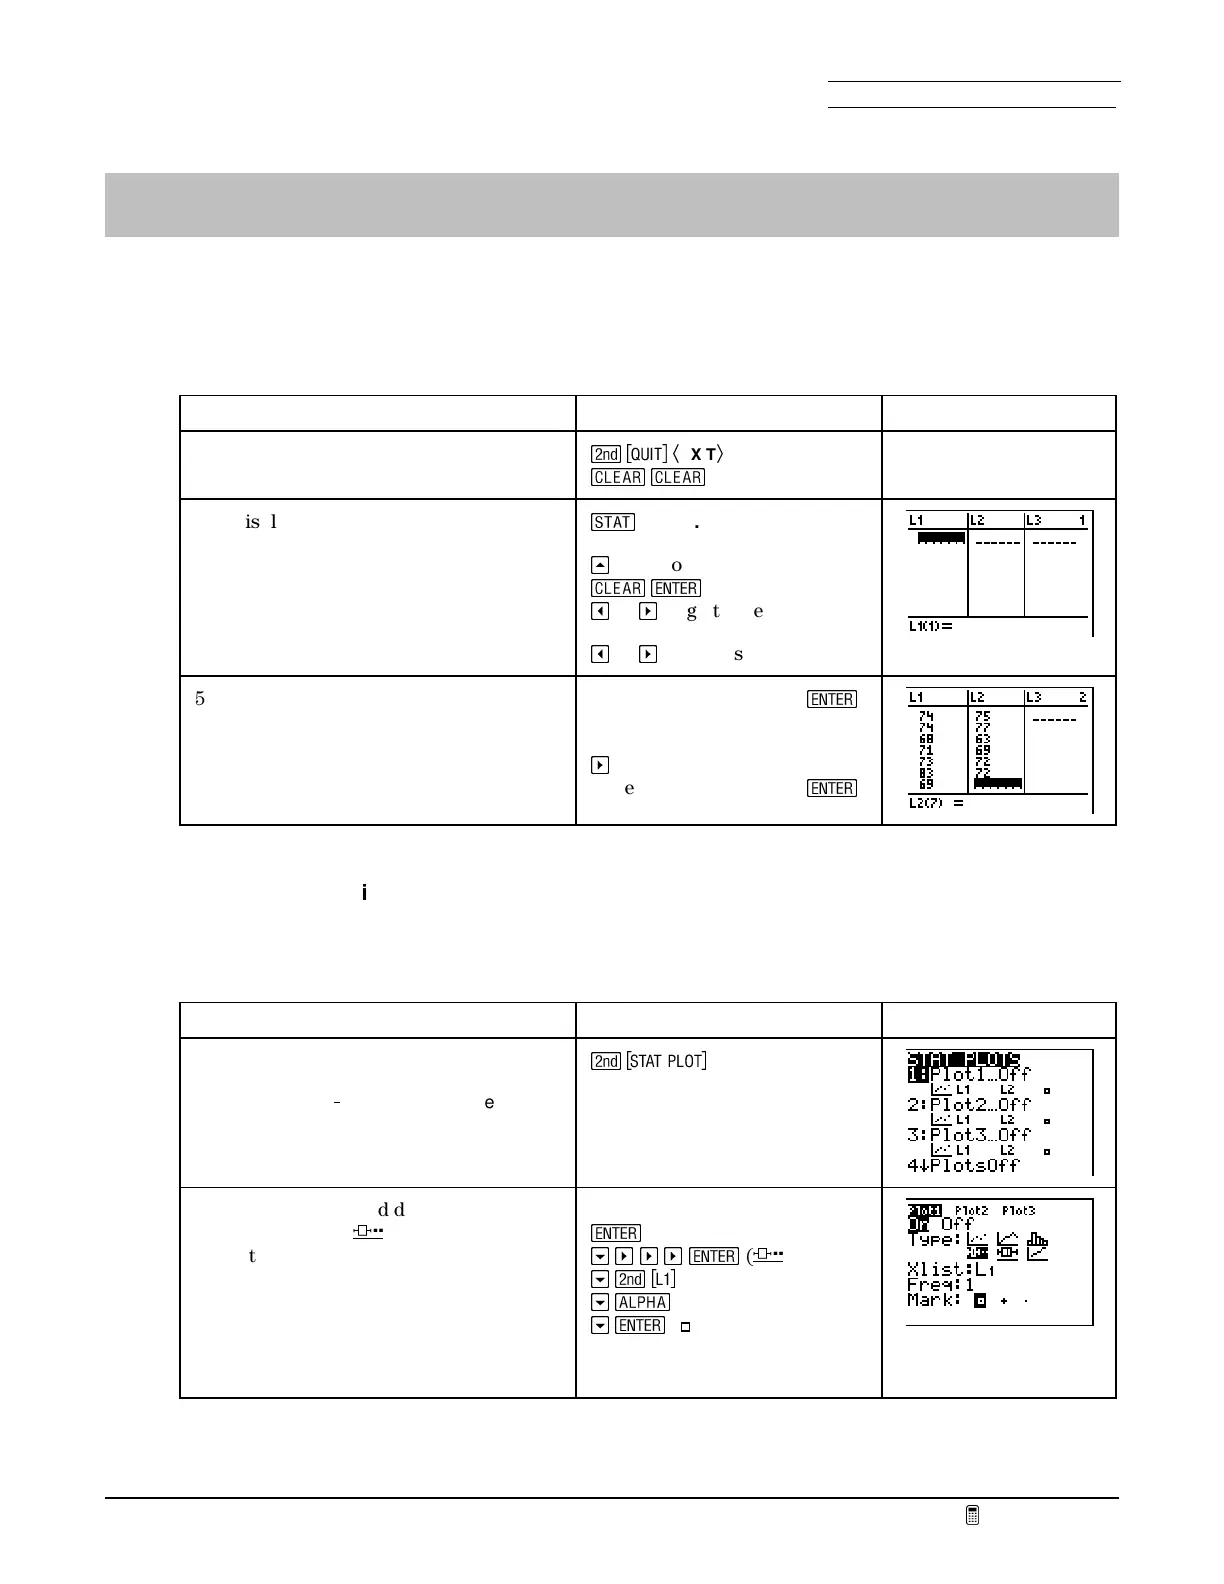
Enter the data
Record the heart rates of all students in the class. Then enter the rates in the list editor (the two
lists do not have to have the same number of elements).
To Do This Press Display
1. Exit Fundamental Topics in Science.
Clear the home screen.
\
Ã
EXIT
Ä
s
s
2. Display the list editor.
3. Clear each list as necessary.
4. Scroll to
L
1
.
g
1:Edit...
`
to go to the list name
s
¯
_
or
a
to go to the next list
_
or
a
, as necessary
5. Enter the rates for the boys in list
L
1
.
6. Enter the rates for the girls in list
L
2
.
Note:
Your numbers will be different than
those shown.
Type each number, then
¯
a
to go to
L
2
Type each number, then
¯
Define the statistical plots as box plots
Once you have entered the lists, you can examine the data using several different types of
statistical plots. First, look at the two forms of box plots.
To Do This Press Display
1. Go to the
STAT PLOTS
screen.
Note:
The TI
83 Plus lets you define up
to three different stat plots.
\
2. Turn on
Plot1
and define it as a
ModBoxplot
(
·
) of the male heart
rates.
Note:
ModBoxplot
graphs the outliers
(data more than 1.5 times the difference
between the third quartile [Q3] and the
first quartile [Q1] ) as points rather than
as part of the box.
1:Plot1
¯
to turn on
Plot1
h
a
a
a
¯
(
·
)
h
\
G
h
e
1
h
¯
(
)

 Loading...


