Section 5: Data & Graphs Name
Date
Fundamental Topics in Science © 2001 Texas Instruments
Try-It!™ 5-1
5: Data & Graphs Try-It!™ on Your TI83 Plus
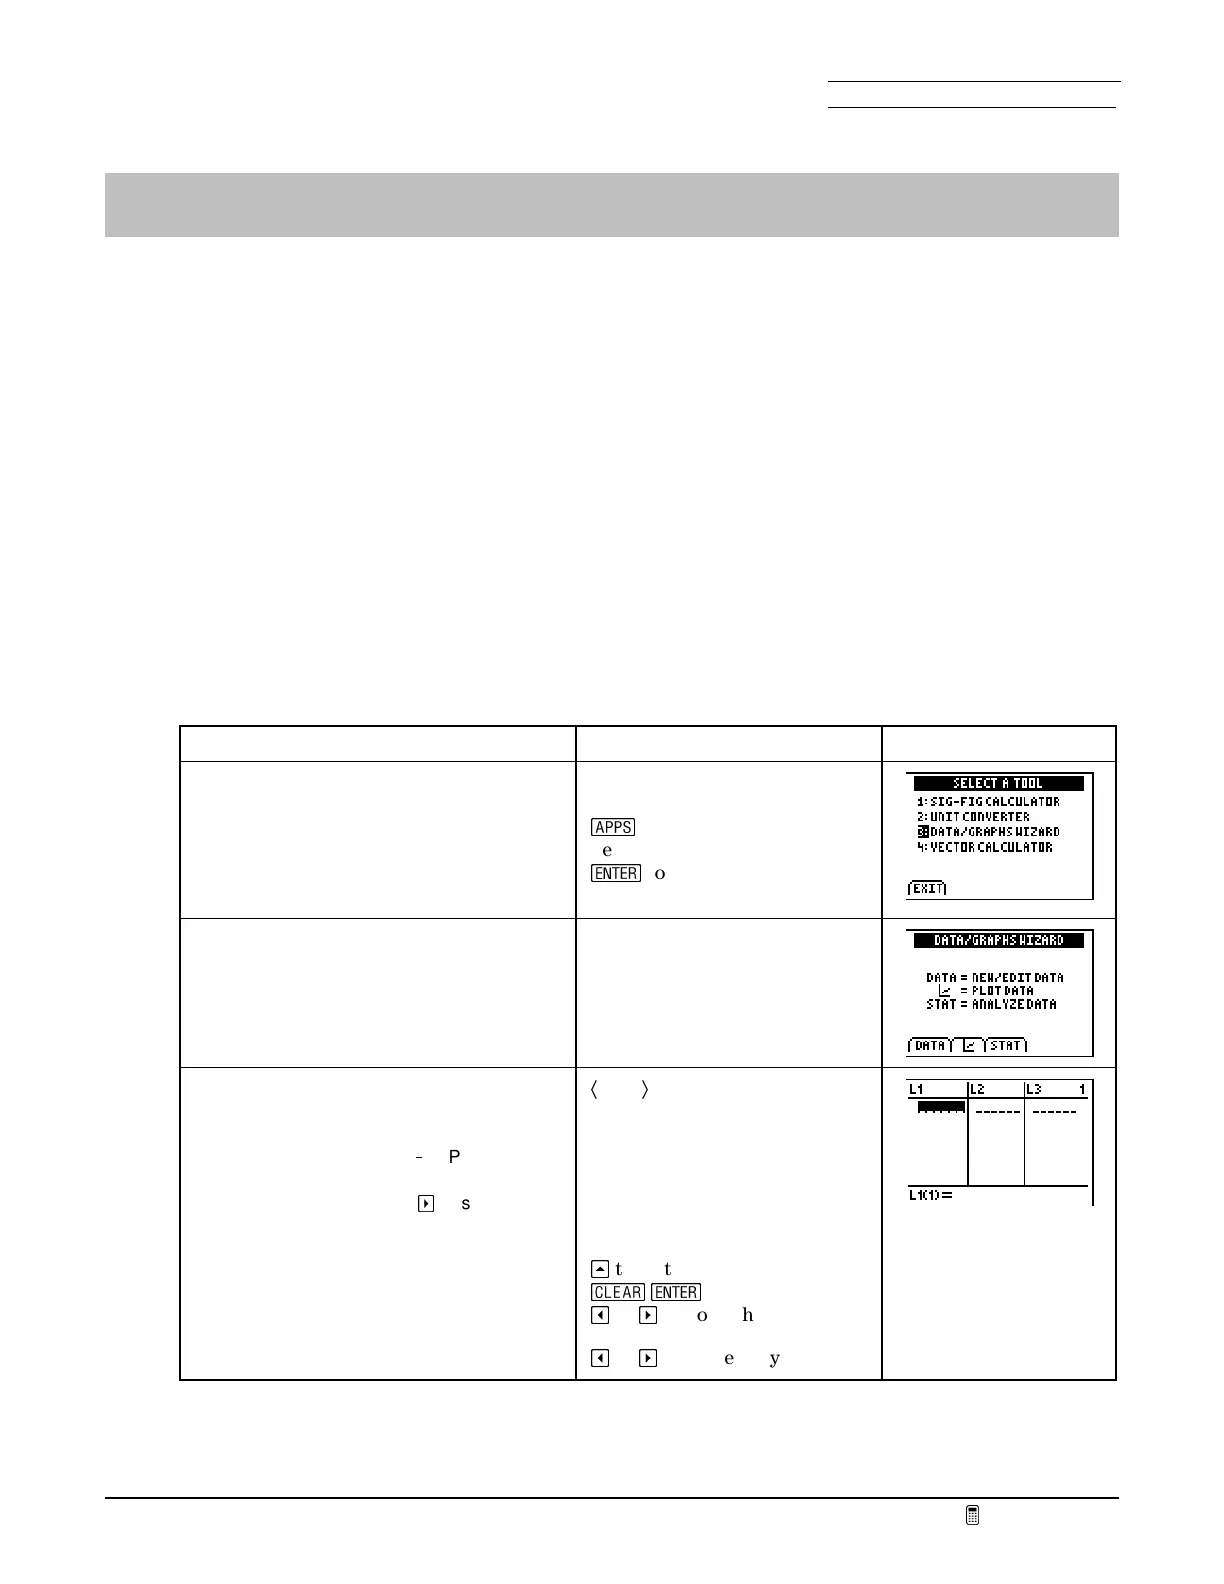
Enter population information into lists with the Data/Graphs Wizard
The United States began the decennial population census in 1790 for purposes of apportioning
congressional seats. In recent decades, the figures also have been used for projecting growth.
Year Resident
Population
Year Resident
Population
1790
1800
1810
1820
1830
1840
1850
1860
1870
1880
1890
3.93
5.31
7.24
9.64
12.9
17.1
23.2
31.4
38.6
50.2
63.0
1900
1910
1920
1930
1940
1950
1960
1970
1980
1990
2000
76.2
92.2
106
123
132
151
179
203
227
249
281
To Do This Press Display
1. Display the
SCIENCE TOOLS
menu.
Note:
You also can access the
SCIENCE
TOOLS
menu from the
SCIENCE
CHAPTERS
menu.
If necessary, exit
FunSci
n
Select
SciTools
¯
to leave the title page
2. Display the
DATA/GRAPHS WIZARD
screen.
3:DATA/GRAPHS WIZARD
4. Select the option for
NEW/EDIT DATA
.
Note:
The
DATA/GRAPHS WIZARD
uses
the list feature of the TI
83 Plus. If the
calculator has named lists in the editor,
you may have to press
a
to scroll to
L
1
.
5. Clear each list as necessary.
6. Scroll to
L
1
.
Ã
DATA
Ä
`
to go to the list name
s
¯
_
or
a
to go to the next list
_
or
a
, as necessary

 Loading...


