TIp 5: Adjusting the Viewing Window
Fundamental Topics in Science © 2001 Texas Instruments
TIp 5-1
TIpË 5: Adjusting the Viewing Window
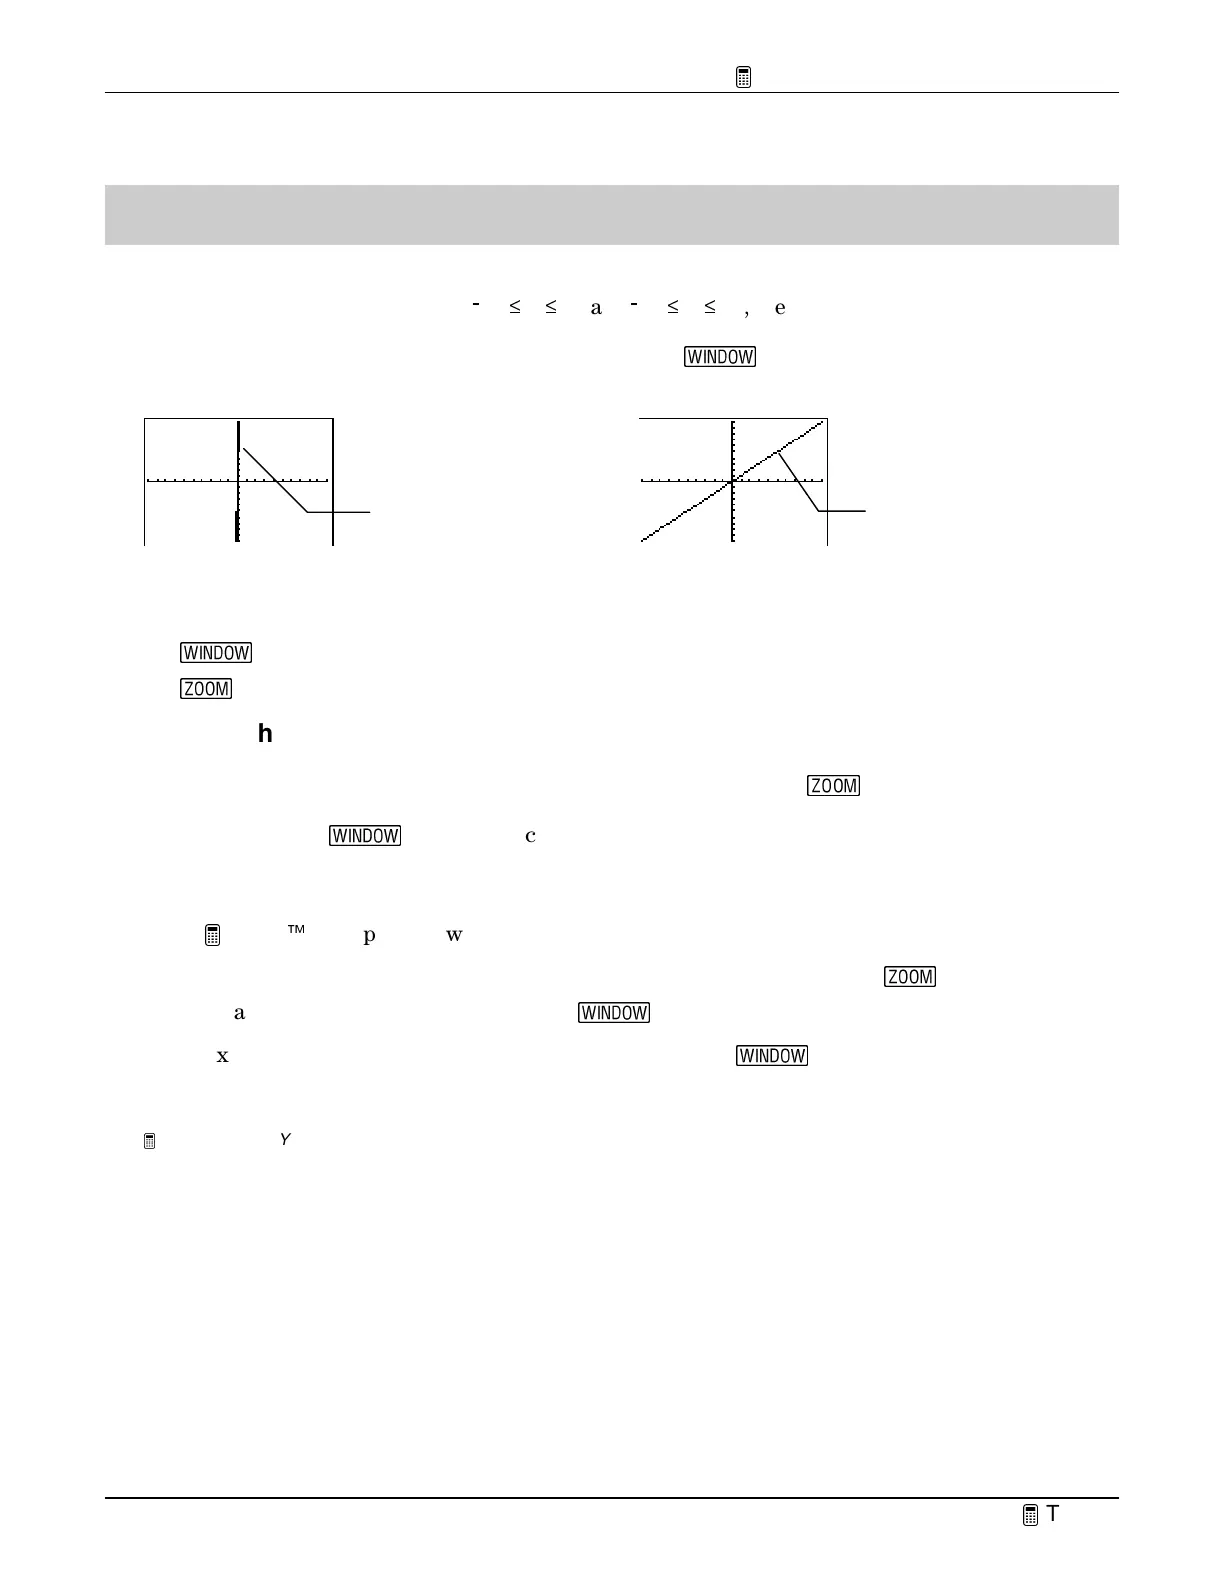
You can adjust the viewing window for a specific graph. For example, with the
ZStandard
viewing window default values of
/
10
^
X
^
10 and
/
10
^
Y
^
10, the graph of
Y
1
=50X
appears as
shown in the screen below on the left.
Y
increases so rapidly in relation to
X
that this line is not
easily seen in this window. You can adjust the window (
'
) values by scaling the
X
axis and
Y
axis to see the graph in a better perspective.
Calculator Keys Used in This
TIp
•
'
•
(
TIp Highlights
Window values
put specific boundaries on the graph screen.
ZOOM
(
T
) functions
automatically adjust window values for you; however, you can manually set window values
using the window
(
S
) menu. You can set minimum and maximum
X
and
Y
values (
Xmin
,
Xmax, Ymin
, and
Ymax
), and you can set the scale (distance between tick marks) of the
X
axis
and
Y
axis (
Xscl
and
Yscl
).
In the
Try-It!
Ë
example, you will adjust the viewing window values in two ways.
•
Automatically adjust them by selecting a zoom function from the
ZOOM
(
(
) menu.
•
Manually adjust them using the window (
'
) menu.
In the example that follows, you see how to change window (
S
) values to see a different
perspective of the graph of
Y
1
=50X
.
Note:
The examples in the next section assume that the calculator has been reset to the default settings as described in
TIp 1:
Resetting Your Calculator
.
Y
1
=50X
viewed
with the default
window values.
Y
1
=50X
viewed with
adjusted window
alues.

 Loading...


