Section 1: Scientific Method Name
Date
Fundamental Topics in Science © 2001 Texas Instruments
Try-It!™ 1-4
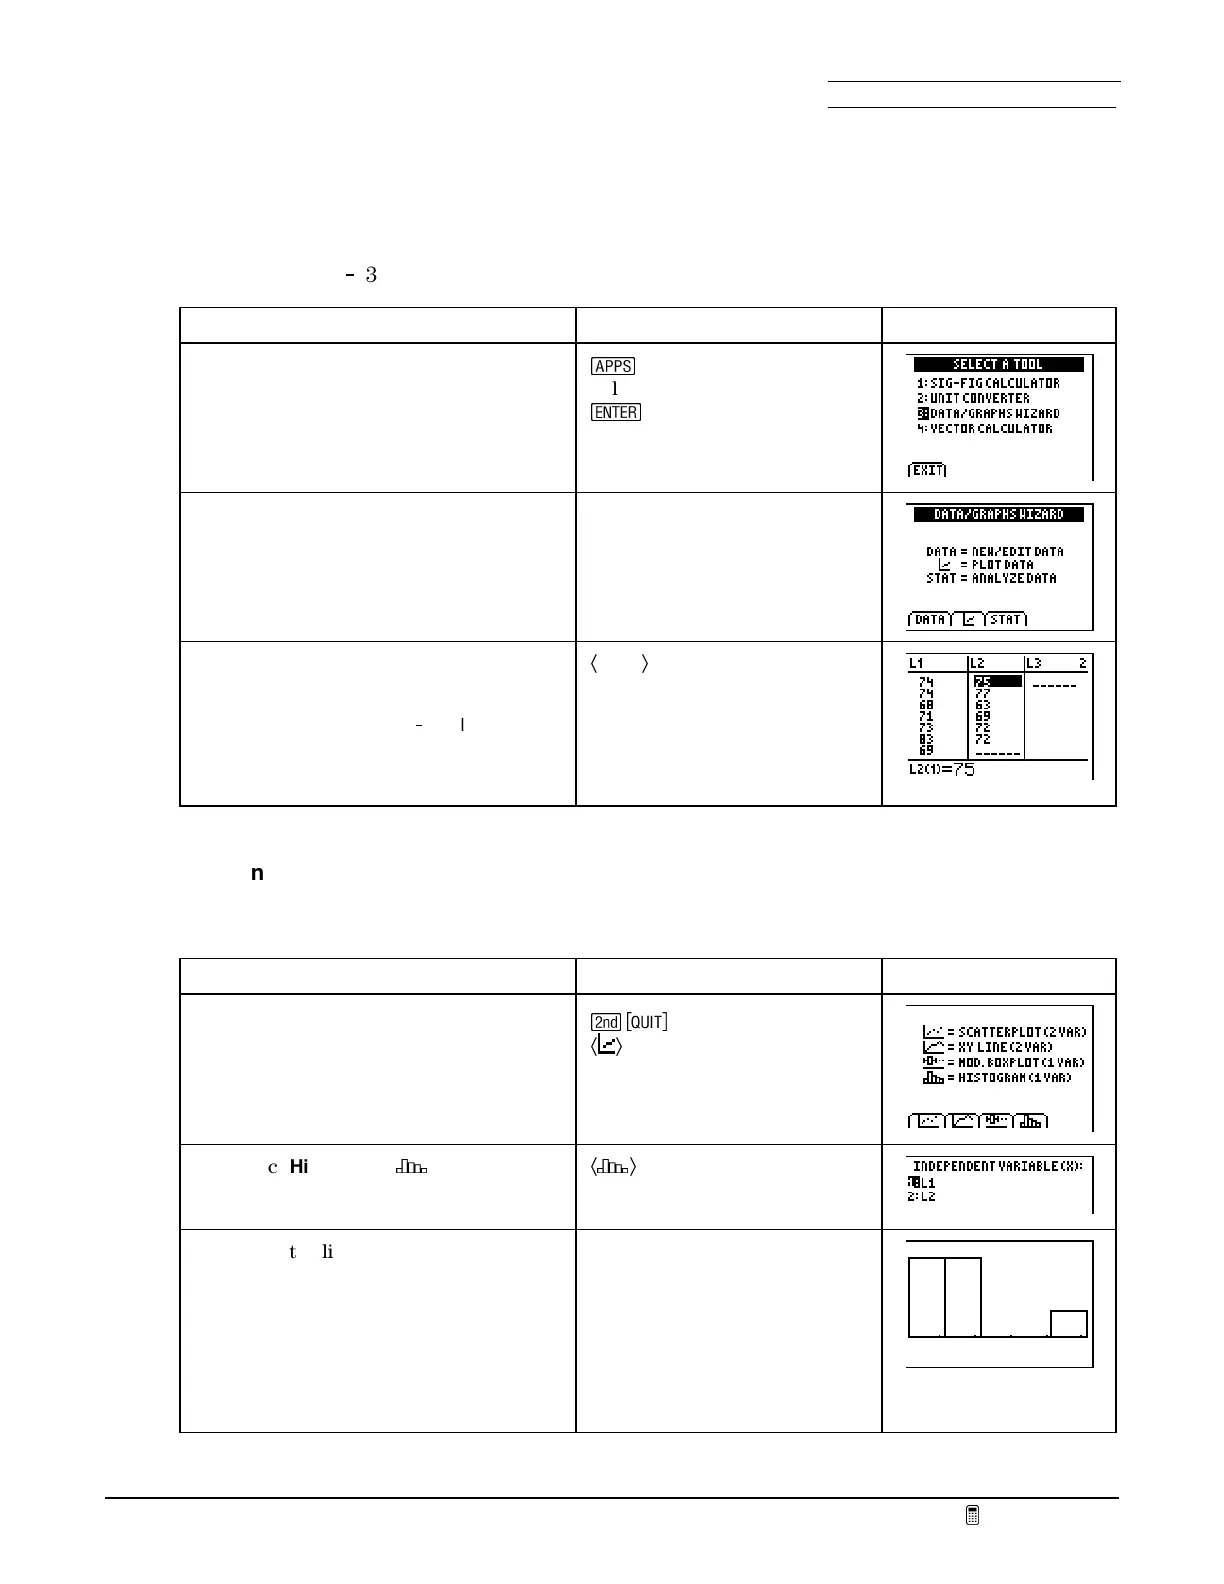
Examine data with the Data/Graphs Wizard
You can use the
DATA/GRAPHS WIZARD
in
SCIENCE TOOLS
to access the list editor and stat plot
features of the TI
83 Plus.
To Do This Press Display
1. Display the
SCIENCE TOOLS
menu.
Note:
You also can access the
SCIENCE
TOOLS
menu from the
SCIENCE
CHAPTERS
menu.
n
Select
SciTools
¯
to leave the title page
2. Display the
DATA/GRAPHS WIZARD
screen.
3:DATA/GRAPHS WIZARD
3. Enter or edit data.
Note:
The
DATA/GRAPHS WIZARD
uses
the list feature of the TI
83 Plus that you
used above. If you had not already
entered the data into lists, you could do
so now.
Ã
DATA
Ä
Define the statistical plots as histograms with the Data/Graphs Wizard
Plot the heart rates as histograms.
To Do This Press Display
1. Display the
DATA/GRAPHS WIZARD
screen and select
PLOT DATA
. A menu
of four types of plots is shown.
Note: Boxplot
and
NormProbPlot
are
not available in the wizard.
\
Ã
Ä
2. Select
Histogram
(
´
).
Ã
´
Ä
3. Select the list for the boys. The
wizard lets you plot only one list at a
time as a histogram.
The data is plotted immediately. The
wizard automatically turns off any
selected Y= equations and plots in the
ZoomStat
viewing window.
1:L
1

 Loading...


