TIp 8: Finding the Best Line of Fit for a Set of Data
Fundamental Topics in Science © 2001 Texas Instruments
TIp 8-1
TIpË 8: Finding the Best Line of Fit for a Set of Data
The TI
83 Plus has regression commands that automatically find the closest equation to your
statistical plot data. The
LinReg(ax+b)
command finds the closest linear equation
y=ax+b
and
displays the values for
a
(slope) and
b
(y-intercept) on the Home screen.
You can save this equation in the Y= editor so that you can graph the regression equation and the
statistical plot data at the same time, and then compare the two.
Calculator Keys Used in This
TIp
g
a
(
CALC
menu)
LinReg(ax+b)
TIp Highlights
This
TIp shows you how to use
LinReg(ax+b)
on the Home screen to find the linear regression
of two list names,
XList
(
L
1
) and
YList (L
2
)
. You will use the same list values that you used to
define the statistical plot.
Note
: For more information about statistical plots, see
TIp 7:
Creating a Statistical Plot
.
In the
Try-It!
Ë
example, you will find a linear regression following these main steps.
1. Select
LinReg(ax+b)
from the
g
CALC
menu.
2. Enter the two list names that define the statistical plot.
3. Save the equation in the Y= editor.
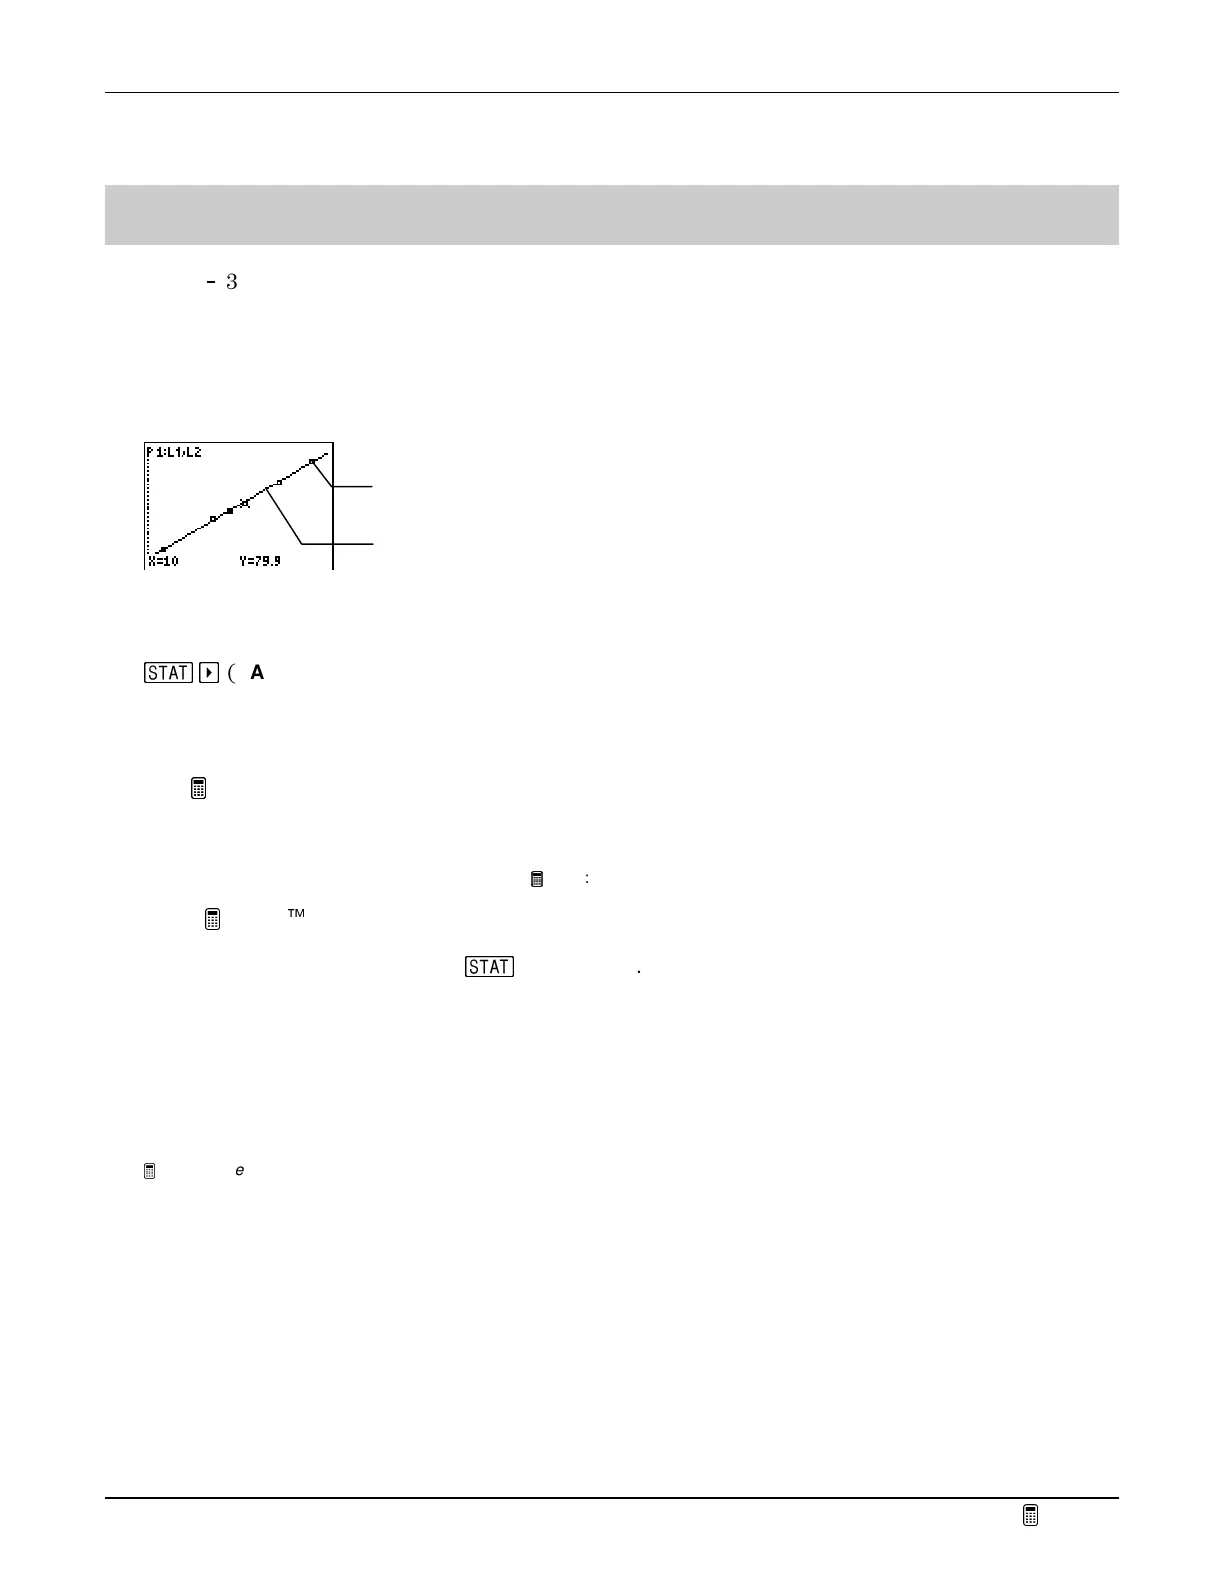
4. Graph the statistical plot and the linear regression.
Note:
The examples in the next section assume that the calculator has been reset to the default settings as described in
TIp 1:
Resetting Your Calculator.
Statistical plot data points
Linear Regression line based
on statistical plot data