Section 5: Data & Graphs
Fundamental Topics in Science © 2001 Texas Instruments Teacher Notes 5-11
Try-It!™ on Your TI
83 Plus
This
Try-It! activity requires the use of the Science Tools application. This free application
came with the Fundamental Topics in Science application and is accessible from the
SCIENCE
CHAPTERS
menu, but it must be loaded separately.
Students use the
DATA/GRAPHS WIZARD
in
SCIENCE TOOLS
to learn about data modeling and
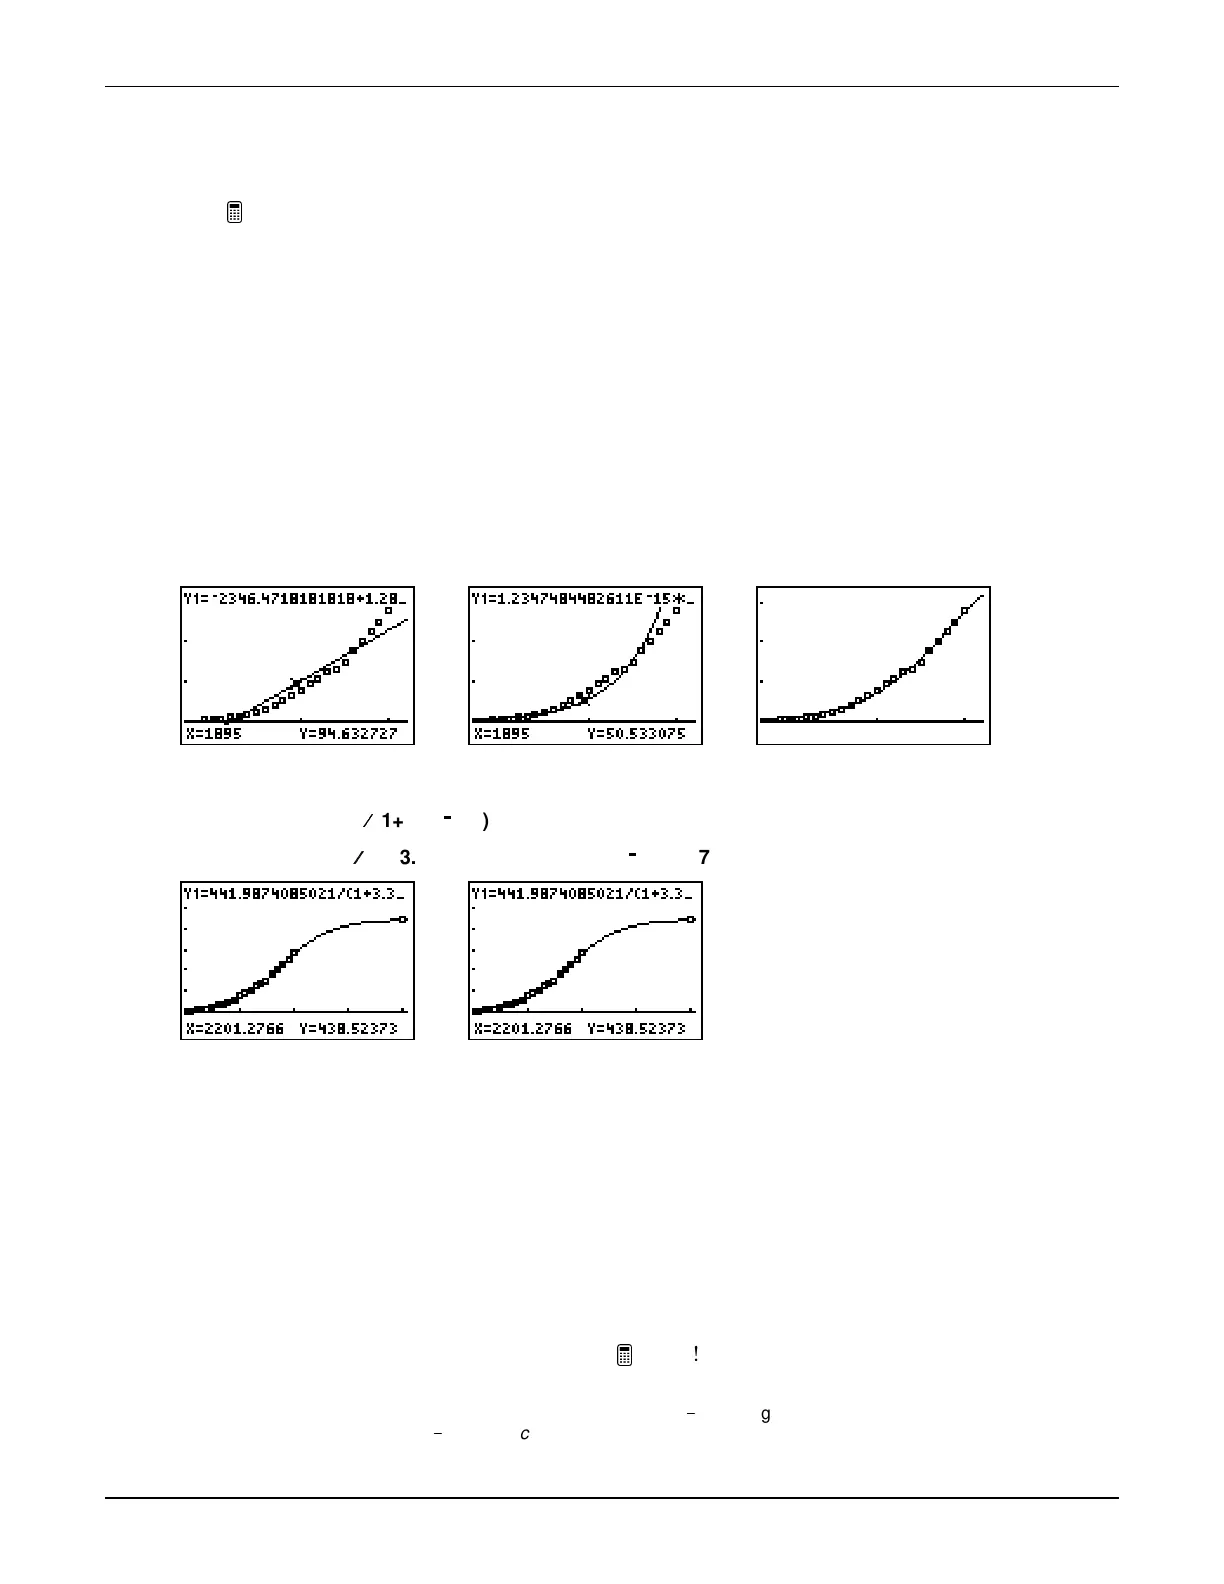
curve fitting, with a population-growth example. They enter the data, plot it as a scatter plot, and
fit three curves to it. They write an analysis for each describing how well the curve matches the
data visually, record the
r
2
for linear and exponential regressions, and discuss how well the
curve would fit the data in the year 2200.
Census data is from chart at http://www.census.gov/dmd/www/resapport/states/unitedstates.pdf, also found in US
Census Bureau,
Statistical Abstract of the United States: 2000
, Table 1
.
A pdf version of this publication is at
http://www.census.gov/statab/www. It has hundreds of statistical tables on topics from Retail Prescription Drug Sales
to Infant Mortality Rates that provide data for trend analysis (click on the Bookmark tab in Adobe
®
Acrobat
®
Reader).
Projections are from http://www.census.gov/population/projections/nation/summary/np-t6-a.txt, which also gives
figures on how births, deaths, and migration affect these totals.
linear regression exponential regression logistic regression
r
2
= .920
r
2
= .965 no
r
2
or
R
2
Logistic model
Y=c
Â
Â
(1+ae^(
0
bx))
Y=441.9874085021
Â
Â
(1+ 3.3566497254812
E
18*
e
^(
0
0.02157773212114X))
Extension
Let students look for a best-fit curve for life expectancy based on year of birth using the figures
below. (This is more complete data than shown in the
INTRODUCTION
.)
Year of birth Life expectancy in US Year of birth Life expectancy in US
1900
1910
1920
1930
1940
47.3
50.0
54.1
59.7
62.9
1950
1960
1970
1980
1990
68.2
69.7
70.8
73.7
75.4
Data from National Vital Statistics Report, Vol. 47, No. 28, 32–33.
Space is provided for written answers on the
Try-It! sheets, but if the students are keeping
journals, you may wish to direct them to record their responses in their journals instead.
Note:
The calculator features are described more fully in the
TI
1
83 Plus
guidebook. The
SCIENCE TOOLS
application
is described more fully in the
TI
1
83 Plus Science Tools
user guide.

 Loading...


