TIp 7: Creating a Statistical Plot
Fundamental Topics in Science © 2001 Texas Instruments
TIp 7-1
TIpË 7: Creating a Statistical Plot
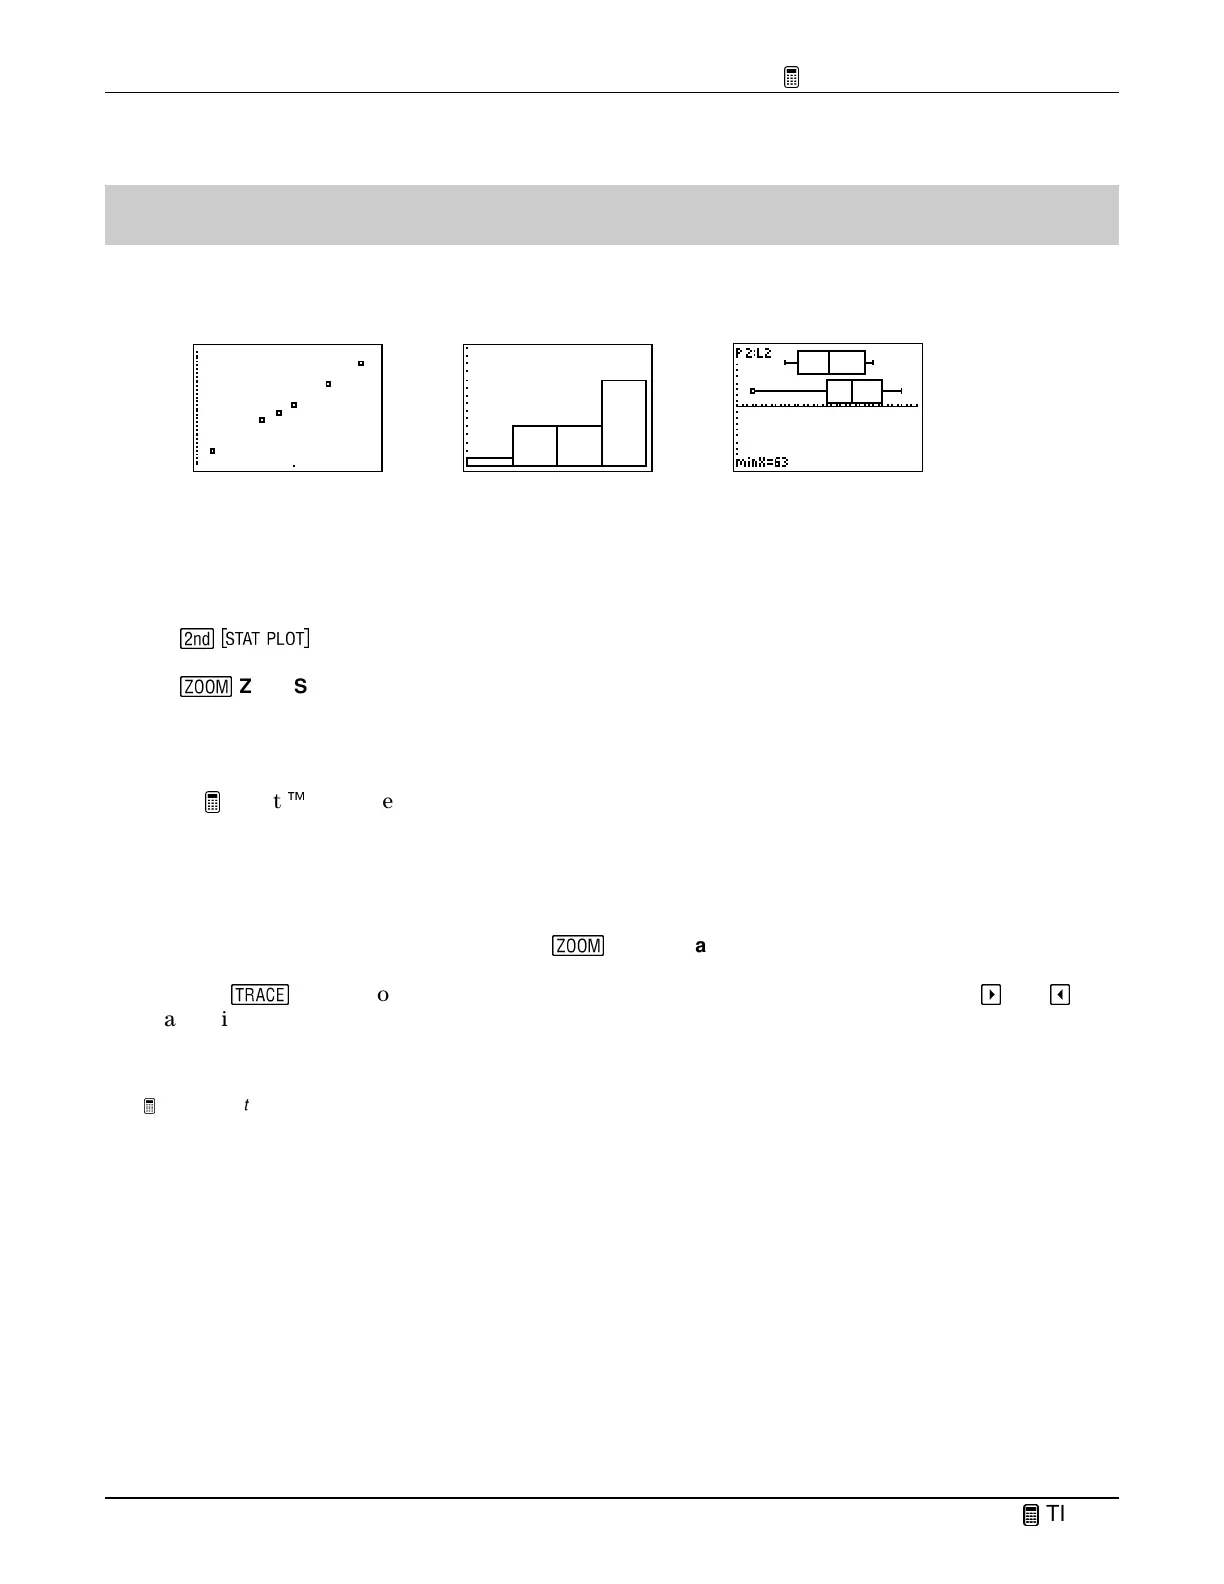
Statistical plots are graphs of data values that have been stored in lists. You can create several
types of statistical plots, such as scatter plots, histograms, and box plots.
Calculator Keys Used in This
TIp
•
-
•
(
ZoomStat
TIp Highlights
In the
Try-It!
Ë
example, you will graph a statistical plot following these main steps.
1. Enter all necessary lists in the list editor.
2. Define your statistical plot in the stat plot editor.
3. Display the statistical plot by pressing
(
(
ZoomStat
).
Pressing
)
allows you to move the cursor from one plotted point to another using
"
and
!
.
It also displays the values (
X
,
Y
) at the bottom of the screen. For more information about
statistical plot options, see the calculator guidebook.
Note:
The examples in the next section assume that the calculator has been reset to the default settings as described in
TIp 1:
Resetting Your Calculator.
Scatter Plot Box Plot Histogram

 Loading...


