TIp 7: Creating a Statistical Plot
Fundamental Topics in Science © 2001 Texas Instruments
TIp 7-2
Try-It!
Ë
on Your TI
83 Plus
You have collected the measurements (in inches) of how far a boy from age 5 to age 14 could
throw a ball above his head. The following data was recorded. Create a scatter plot (
Ô
) based
on these lists, where
L
1
= Age in years and
L
2
= Distance in inches.
Age in years (L
1
) Distance in inches (L
2
)
5 66.9
8 75.8
9 77.7
10 79.9
12 85.8
14 91.7
Enter the Lists in the List Editor
See
TIp 6:
Using Lists
for step-by-step instructions for entering lists of data (remember to use
ClearAllLists
and
SetUpEditor
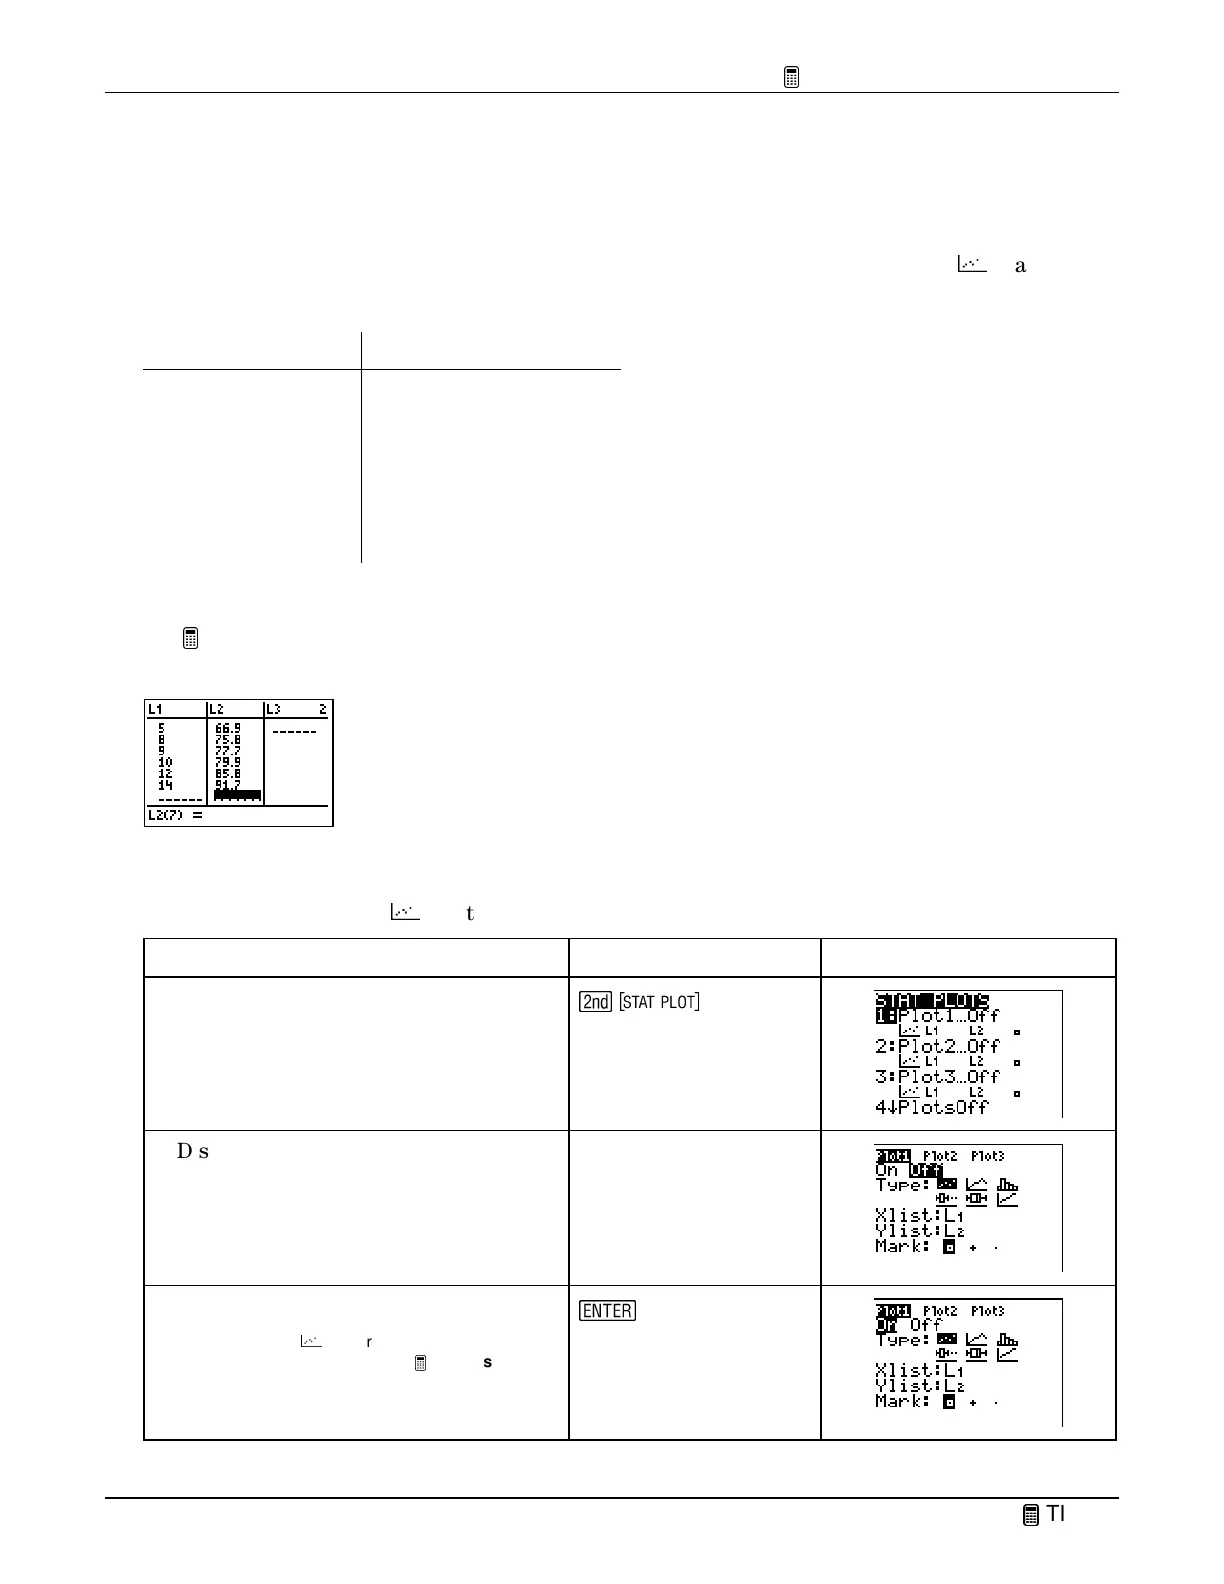
). Your list editor should look like this:
Define the Statistical Plot
Define
Plot1
as a scatter (
Ô
) plot where
Xlist=L
1
and
Ylist=L
2
.
To Do This Press Display
1. Display the
STAT PLOTS
screen.
\
2. Display the
Plot1
settings screen.
1:Plot1
3. Select
On
to turn on
Plot1
.
Note:
Scatter
(
Ô
), is already selected because
you reset the calculator for this
TIp.
Xlist
and
Ylist
do not have to be changed because, by
default, they already match our selected lists.
b

 Loading...


