Section 5: Data & Graphs Name
Date
Fundamental Topics in Science © 2001 Texas Instruments
Try-It!™ 5-2
Enter population information into lists with the Data/Graphs Wizard (cont.)
To Do This Press Display
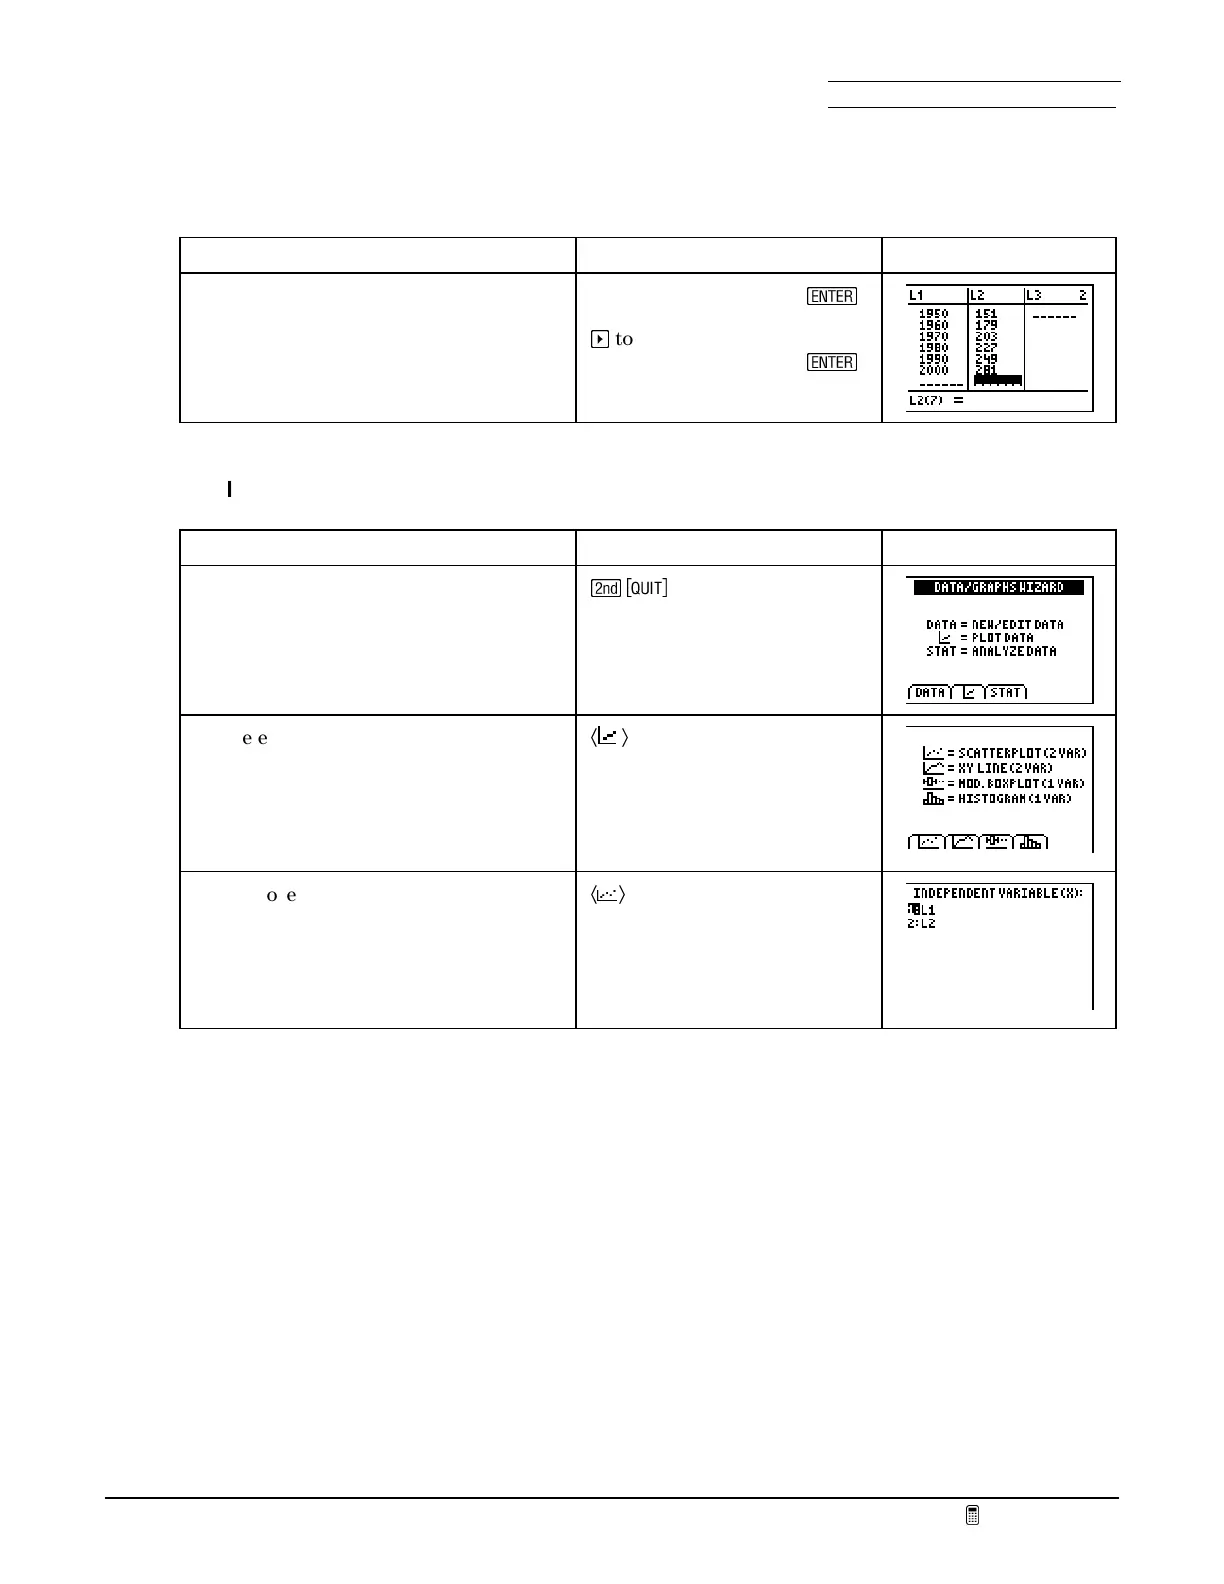
7. Enter the years into
L
1
.
8. Enter the population into
L
2
.
Type each number, then
¯
a
to go to
L
2
Type each number, then
¯
Plot the data
To Do This Press Display
1. Display the
DATA/GRAPHS WIZARD
screen.
\
2. Select
PLOT DATA
. The
DATA/GRAPHS
WIZARD
offers four types of plots. The
SCATTERPLOT
and
XY LINE
are
appropriate for paired data.
Ã
Ä
3. Choose a scatter plot. For your
convenience, the
DATA/GRAPHS
WIZARD
shows only the names of lists
that have data in them.
Ã
Ä

 Loading...


