TIp 5: Adjusting the Viewing Window
Fundamental Topics in Science © 2001 Texas Instruments
TIp 5-3
Try-It!
Ë
on Your TI
83 Plus
(continued)
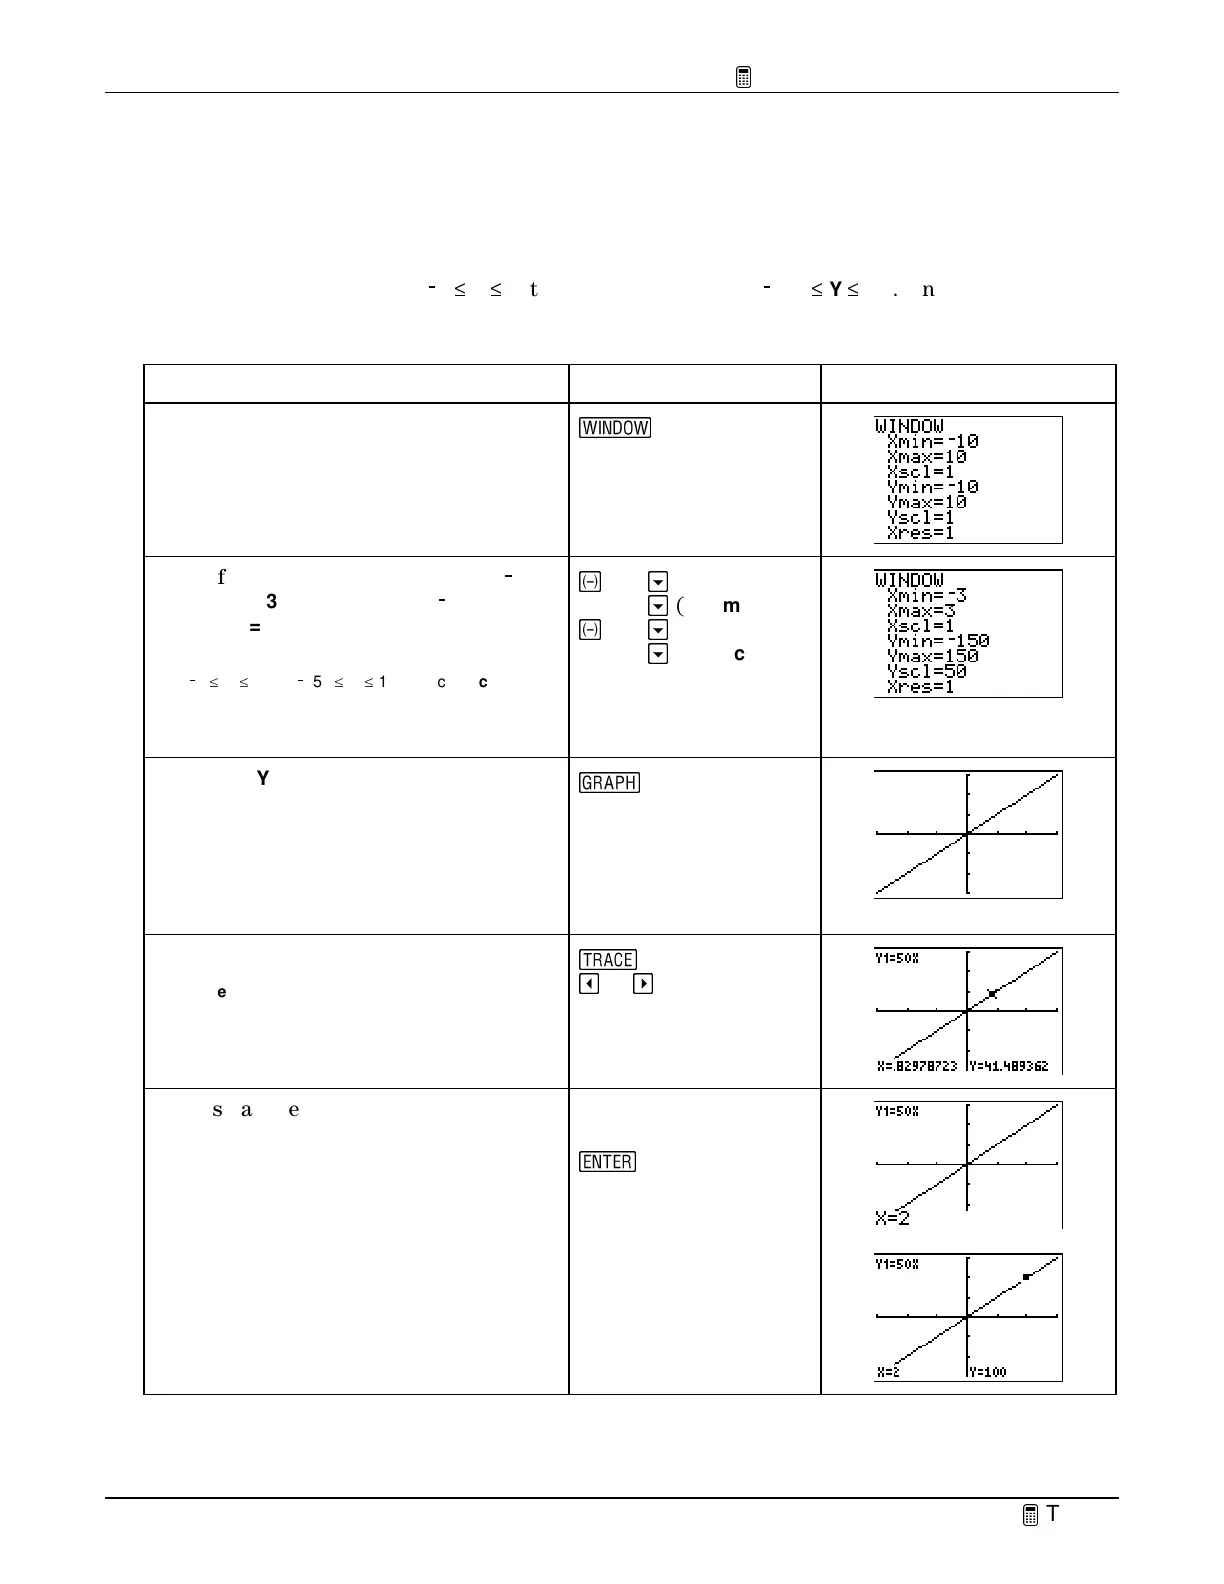
Define a Different Viewing Window for Your Graph
(continued)
Notice in the table that when
/
3
c
X
c
3, the
Y
values range from
/
150
c
Y
c
150. Since
Y
increases
by 50 each time
X
increases by 1, you can set the
Yscl
to 50 and leave
Xscl
set at 1. Now, create a
window to see the graph for this domain and range by changing the window values.
To Do This Press Display
1. Display the window settings screen.
S
2. Define the values so that
Xmin =
0
0
3,
Xmax = 3, Xscl = 1,Ymin =
0
0
150
,
Ymax = 150
, and
Yscl = 50
.
Note:
This changes the settings so that:
/
3
^
X
^
3 and
/
150
^
Y
^
150. Since
Xscl=1
and
Yscl=50
, there is one unit between each tick mark
on the
X
axis and 50 units between each tick mark
on the
Y
axis.
a
3
#
(to
Xmax
)
3
#
(to
Ymin
)
a
150
#
(to Ymax
)
150
#
(to Yscl
)
50
3. Graph
Y
1
=50X
in this different
window.
Note:
Remember that each tick mark on the
X
axis
represents 1 unit, while each one on the
Y
axis
represents 50. It’s always important to know the
scale of your graphs so that you understand the
graph you are viewing.
*
4. Trace the graph.
Note:
Each tick mark on the
X
axis is 1 and on the
Y
axis is 50.
)
!
or
"
as necessary
5. Display the
Y
value when
X=2
.
Tip:
You can go directly to any coordinate pair on
the graph by entering the value you want.
2
b

 Loading...


